Last month, the (newly elected) sports committee of NID Bangalore organized a Table Tennis Tournament. Now I’ve started playing table tennis quite often at NID, so I happily participated. Defeated in the quarter-finals by Amal, I was watching others in awe until I got a random idea. Visualization time!
So here’s my first attempt at making a data visualization: Final matches between Amal & Upamanyu.

Still here? Awesome. Here’s a quick look at how I made it: The idea was impromptu – I had not planned it, so I didn’t think much about how to record data. I decided to simply make dots: One for each point, in two columns. I kept recording scores after 5 serves (when serve changes) to tally my data.
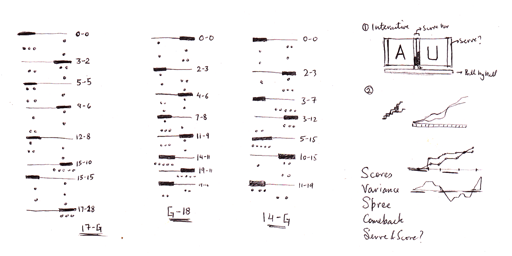
This easily translated into a string of 0′s & 1′s: 0 for Upu’s point, 1 for Amal’s point. I typed these into Excel, and let the conditional formatting do some magic.
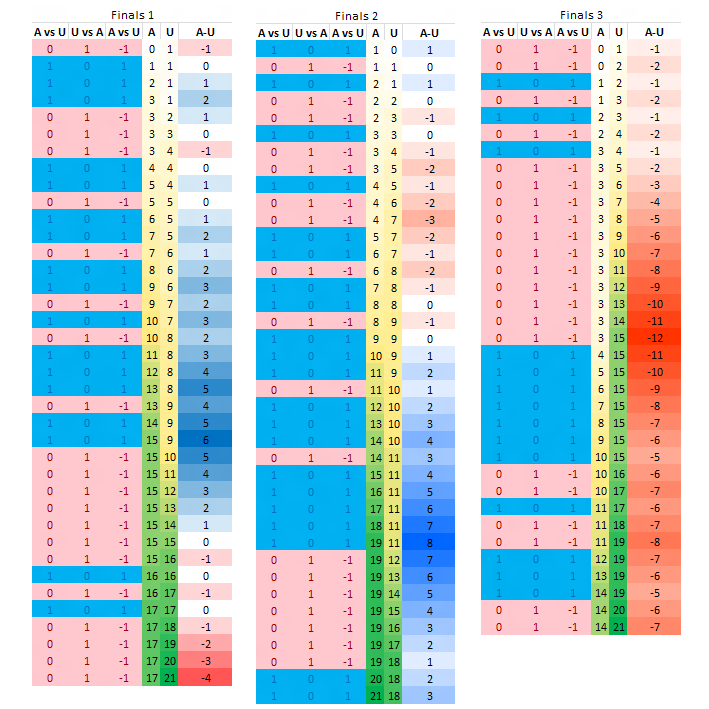
Sweet, eh? The columns are individual points (3 columns), cumulative score of Amal & Upamanyu (4 & 5), relative score (for each of the three matches) It’s the relative score that seemed quite interesting to me (It also highlighted the difference in each match instantly!). For more ideas, I tried a few charts. I wanted to highlight two things: the continuous streaks of points, and the relative difference in score throughout the game.
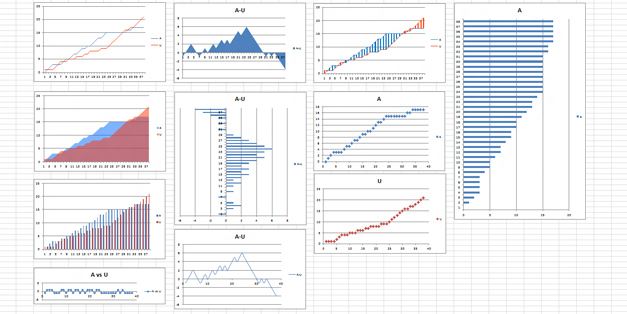
My favorite? A simple line chart (Others seemed harder to understand/biased to one person). Technically, the correct chart to use should be a bar chart (since points are discrete), but the chart looked horrible in Excel (I tried sketching a mix of line & bar chart, which looked more like stairs than a graph). Maybe I’ll try a more honest chart next time!
With this decided, I tried to re-create the line chart in Processing. The advantage was that I could plot it serve by serve, maybe turn it into an interactive visualization later? I also decided to add the relative scores along the X Axis (To emphasize on the lead a bit more). Circles seemed to stand out a bit, which was just what I wanted. Here’s a quick gif animation of the first match.
Finally, I exported (saveFrame) from Processing, added some text in Photoshop, and voila! Here it is!
This is my first attempt at data visualization (and at making something useful in Processing!), so I’m sure there’s a lot for me to learn. Was the chart hard to understand? Or is there something I could’ve done better? Feel free to comment! :)
PS. Special thanks to these people:
- Anand S from Gramener for showing me what Excel can really do (while visualizing student browsing patterns). Thanks Rahul for getting me along!
- Gene Kogan for motivating me to finish the Processing code. (He’s running an awesome Generative Art workshop at Jaaga).
- And Amal, for defeating me in quarter-finals, so I could make this. :D
Here’s hoping this is the first of many visualizations. Fingers crossed!