I was invited back at my alma mater to teach M.Des. Information Design students for their Geo Visualization & Digital Cartography module, led by Prof. Chakradhar Saswade. My sessions focused on an introduction to Cartography, types of Geo Visualization, Schematic Mapping, Sensory Mapping & Choropleths in Excel!
Hometown Schematic Map
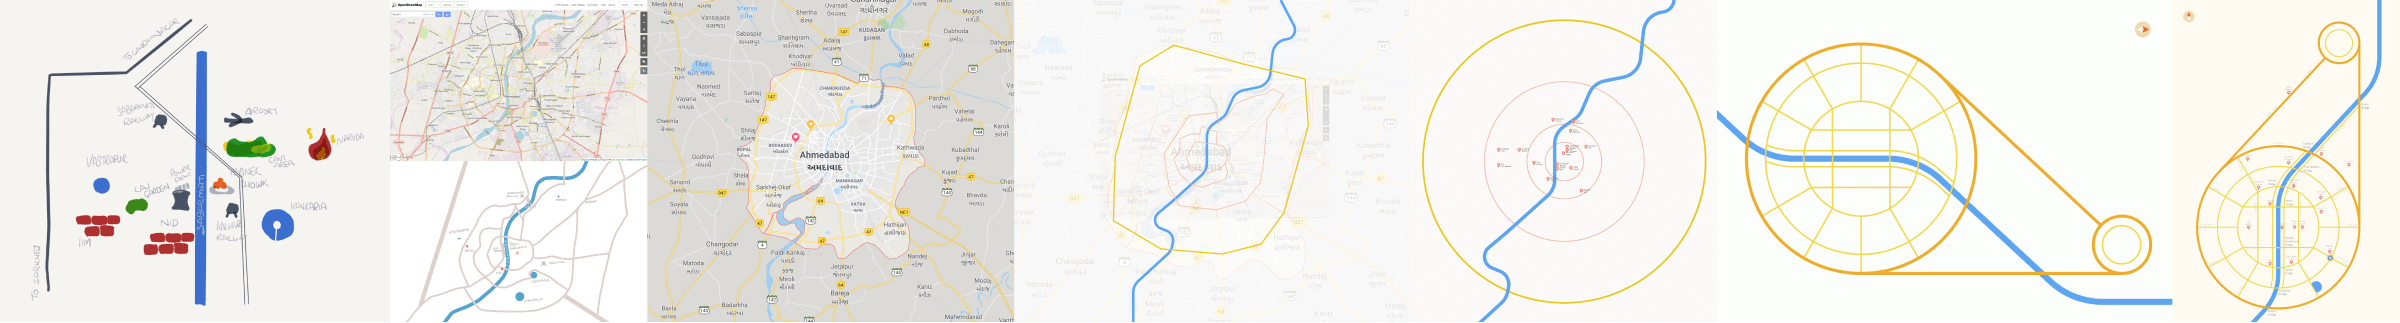
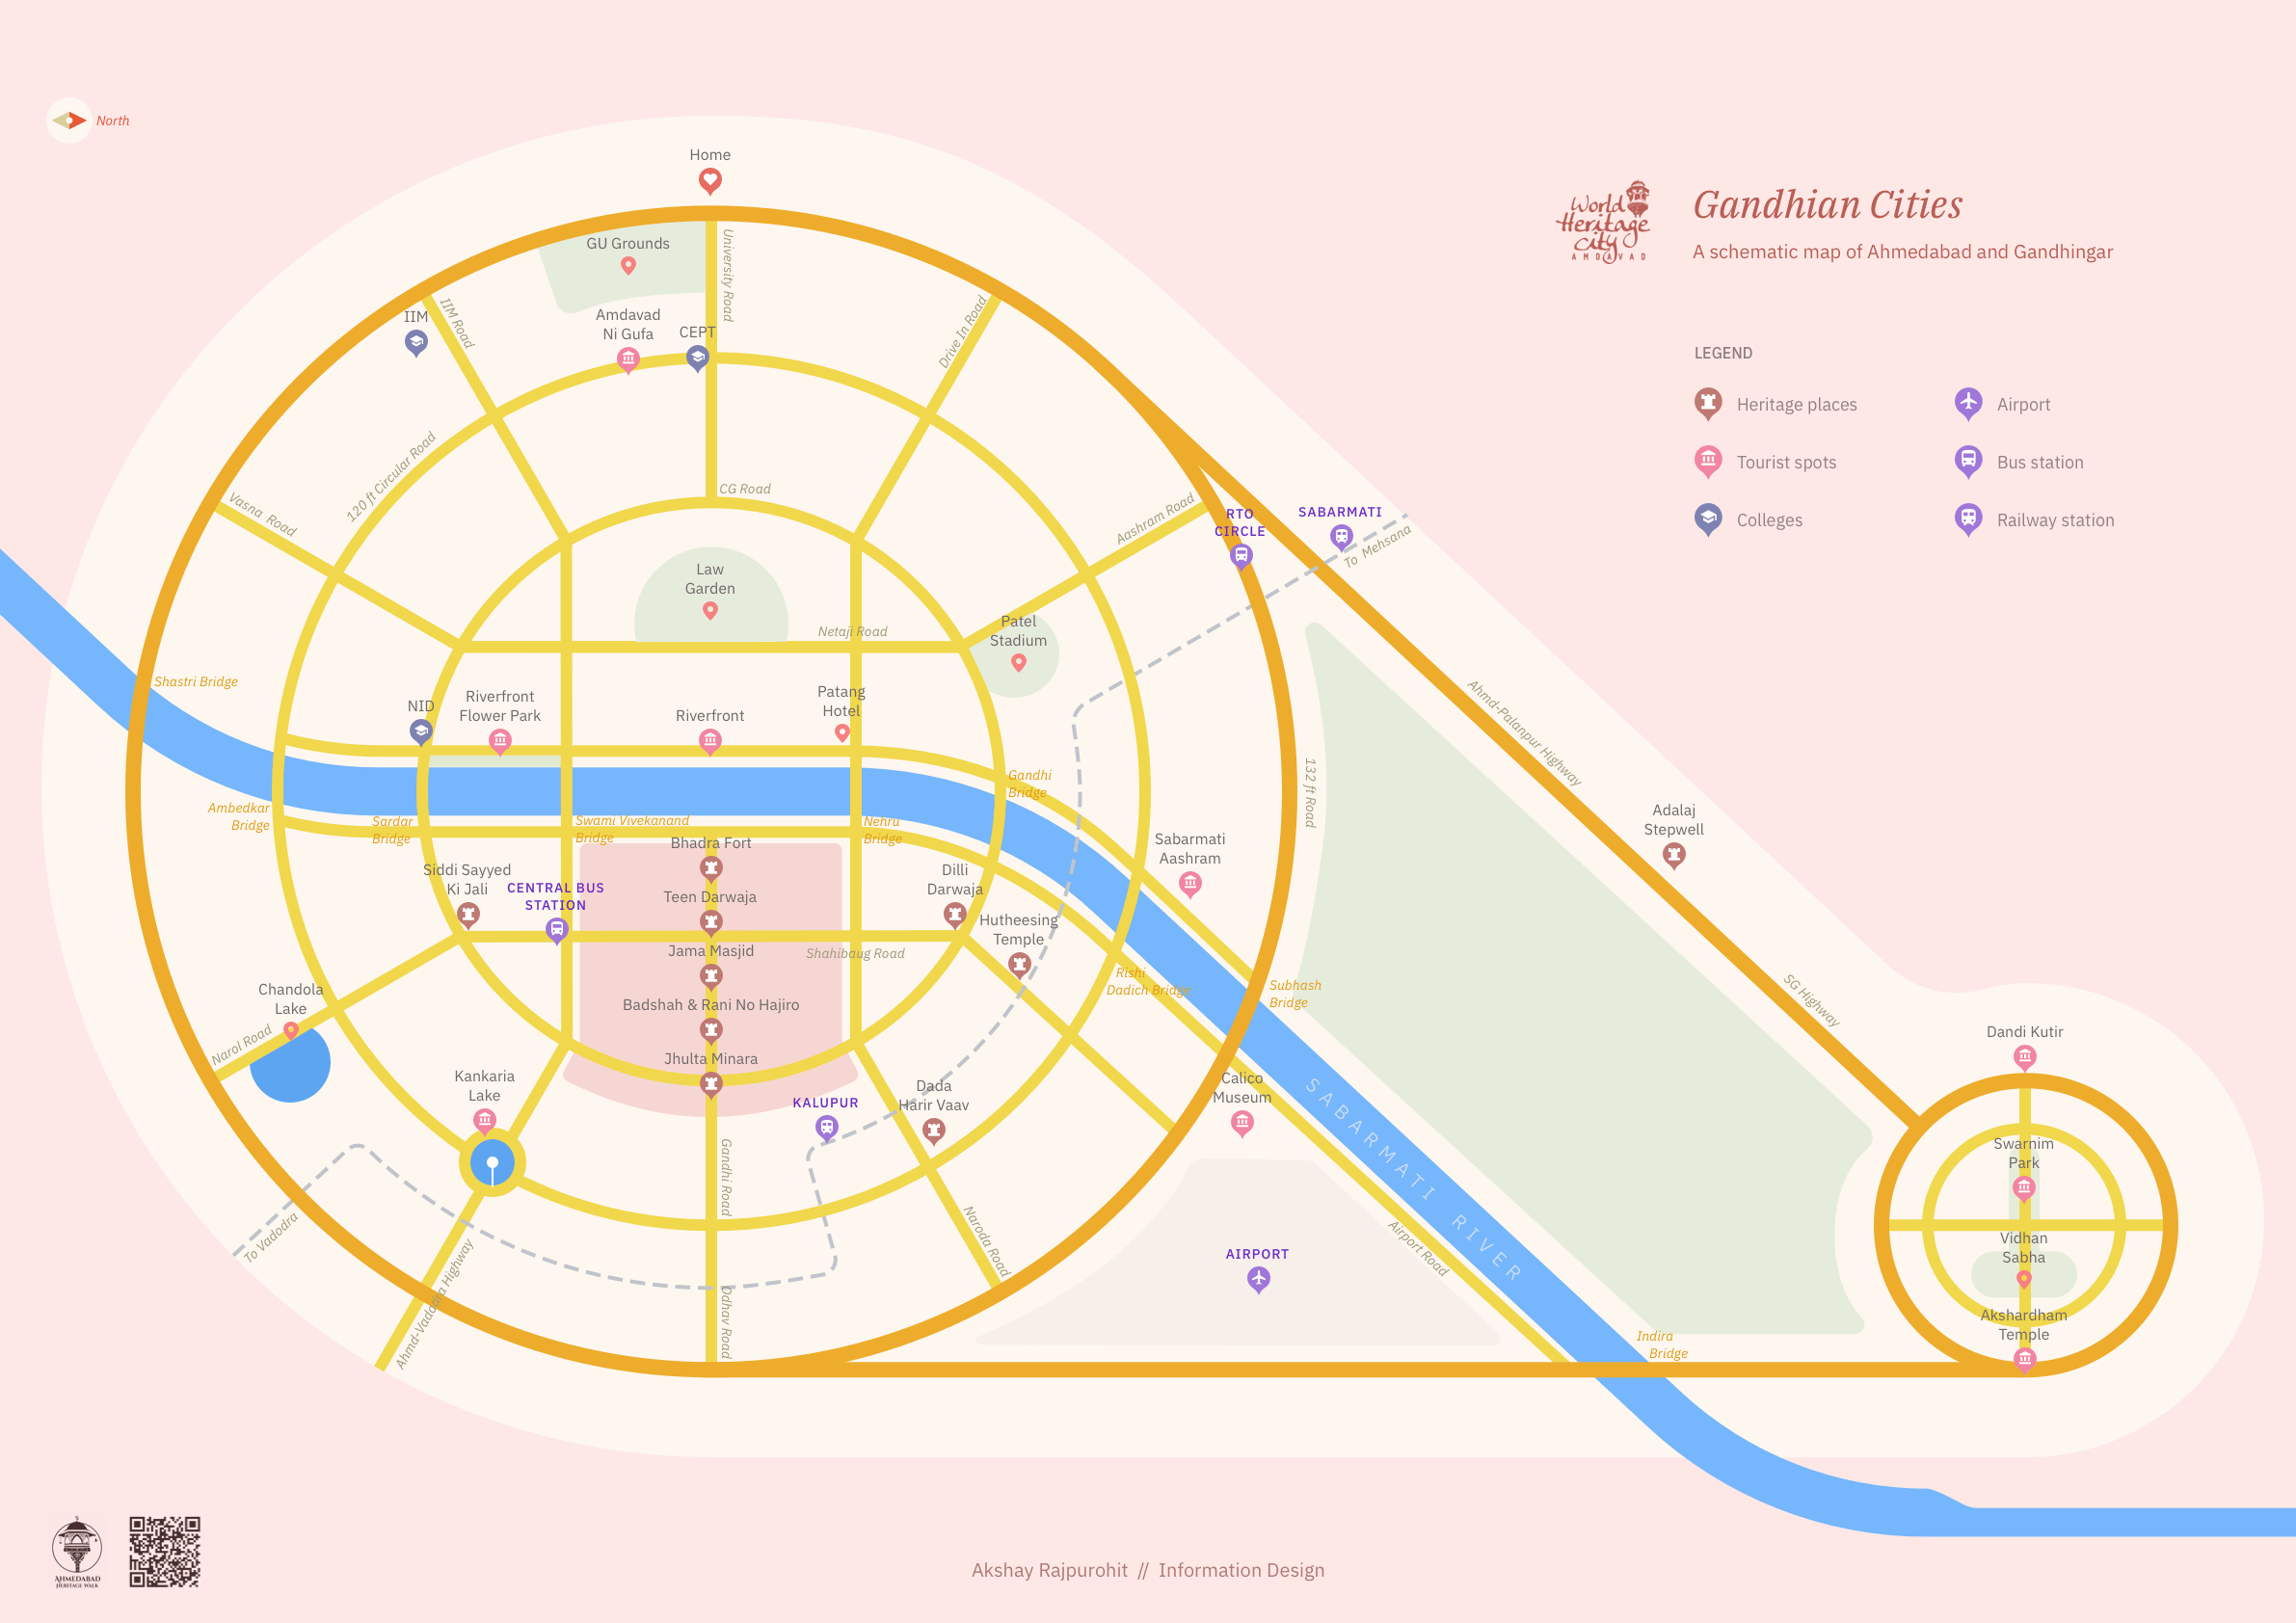
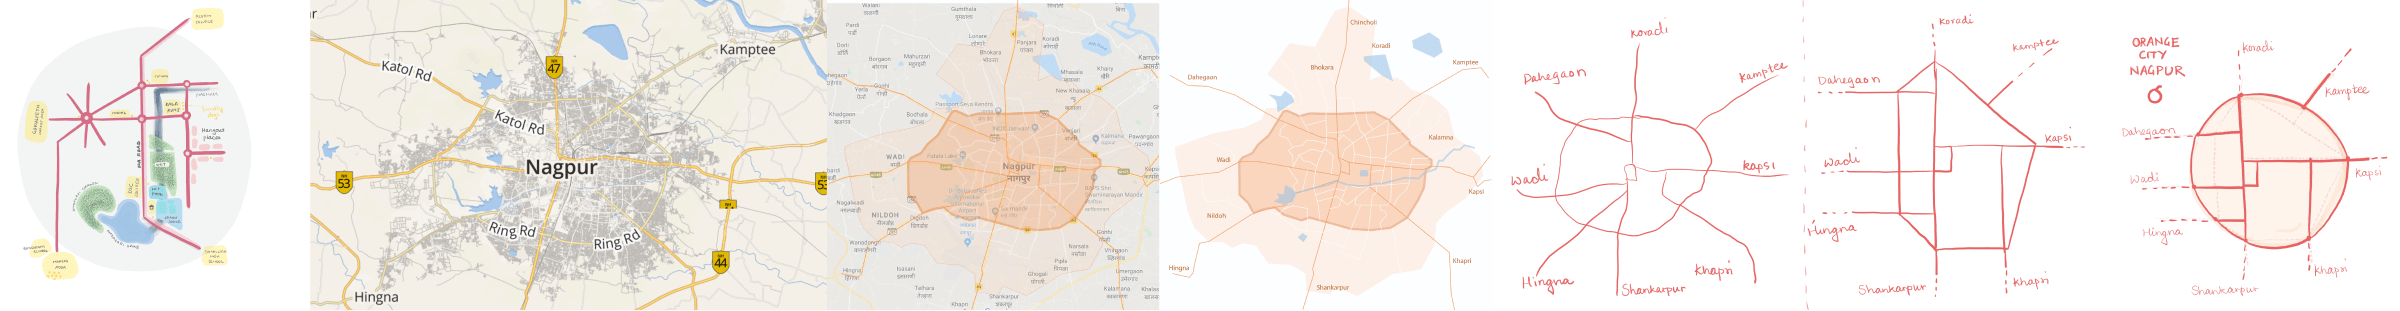
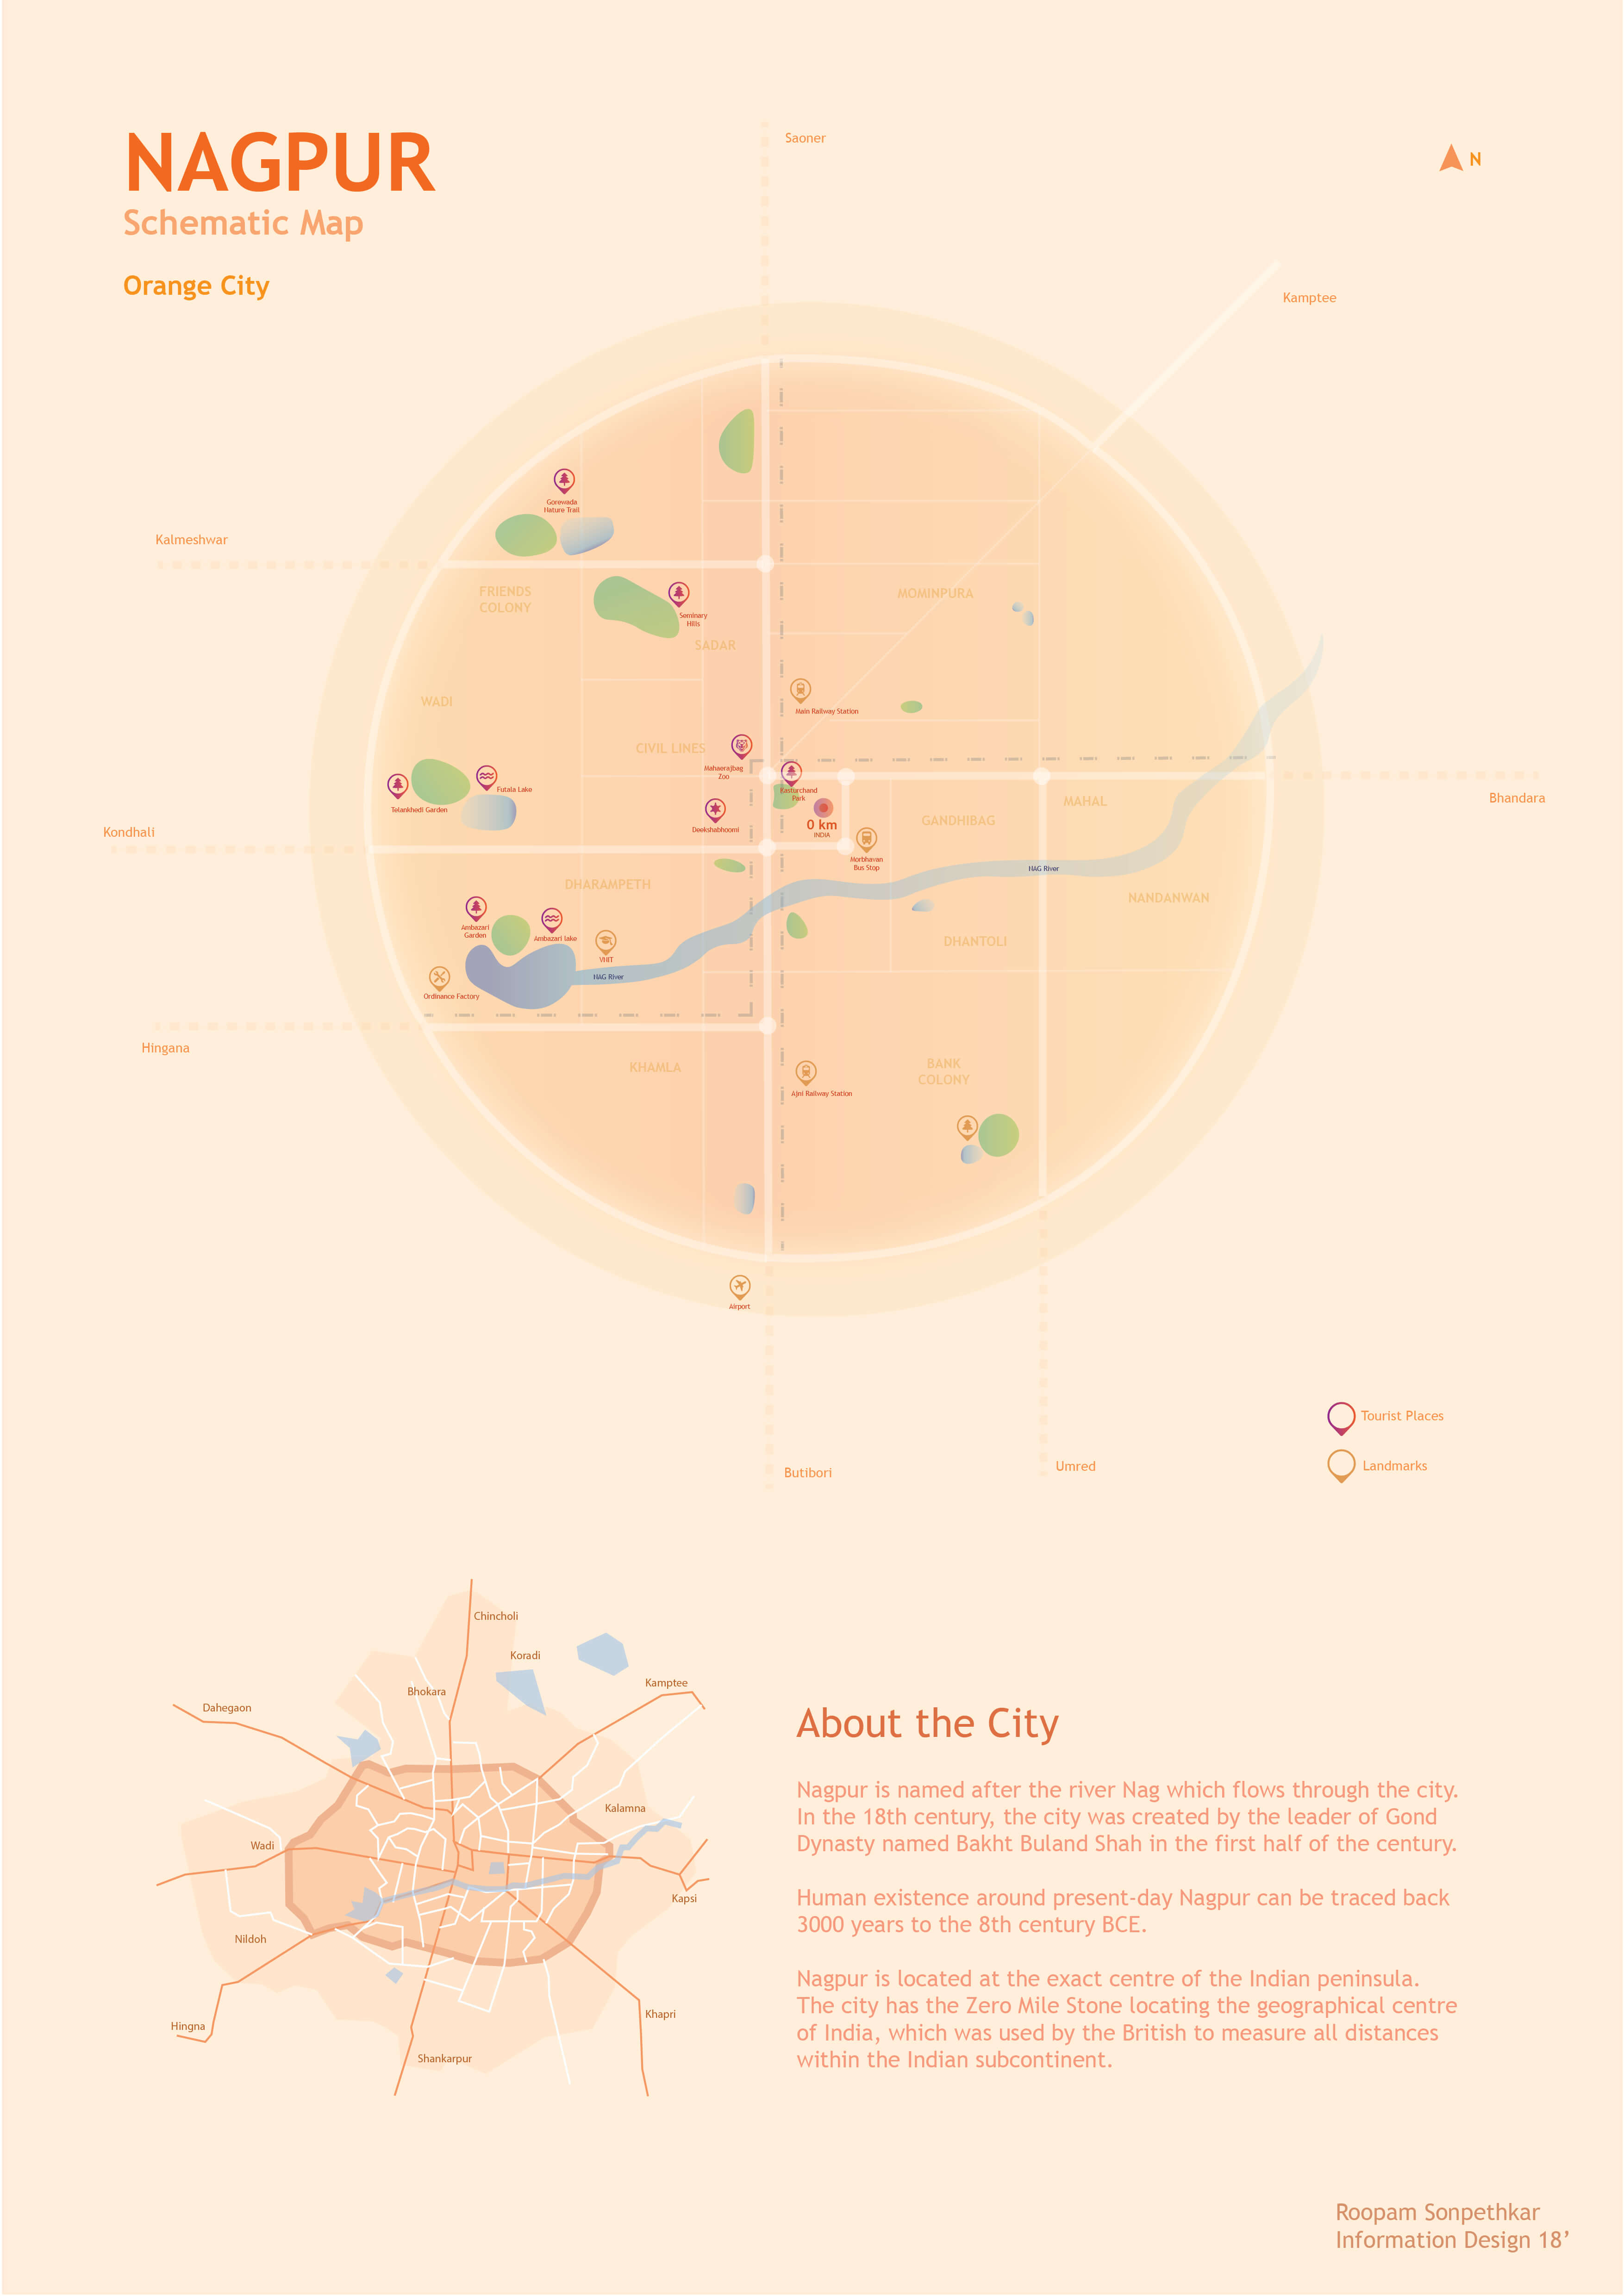
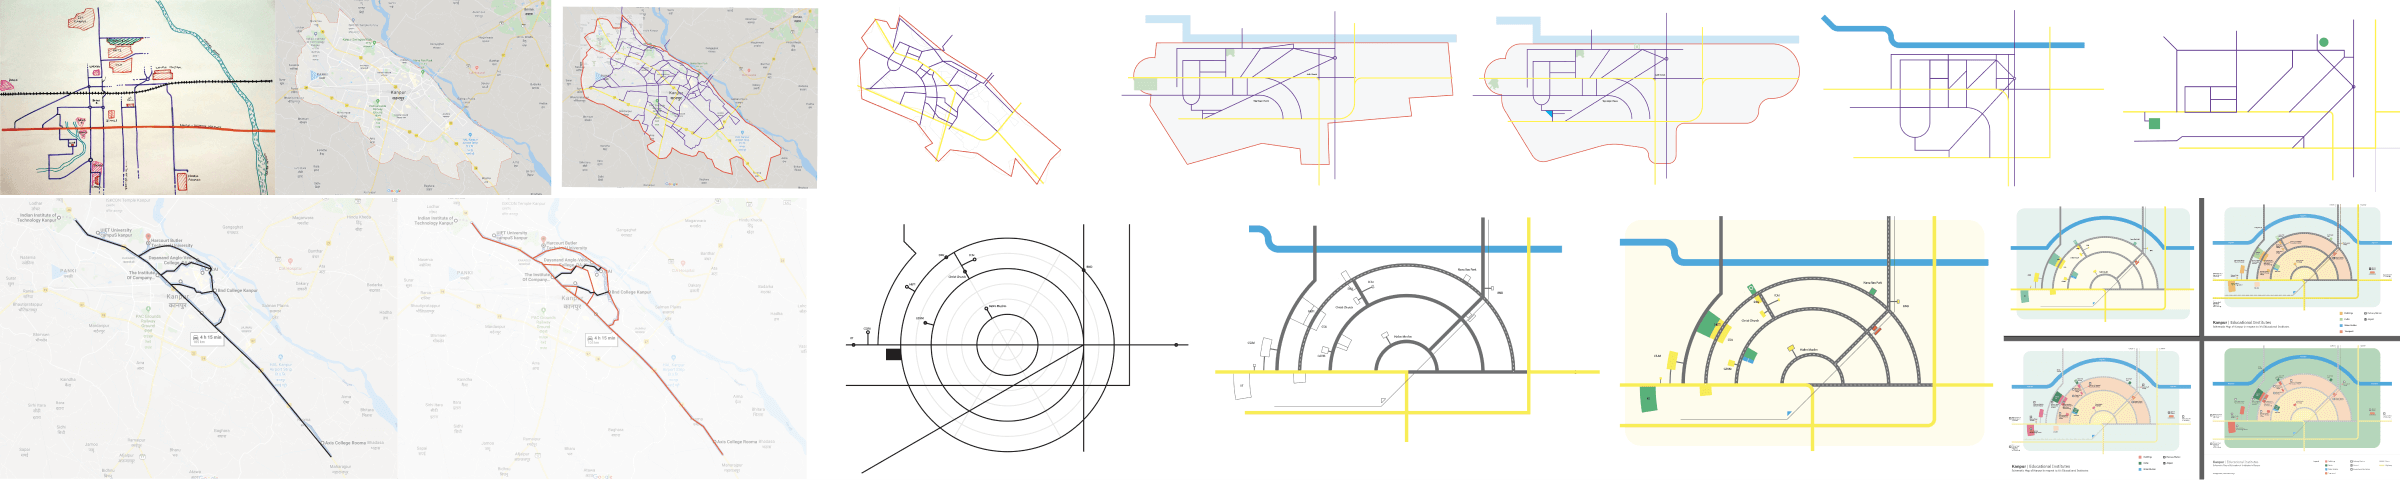
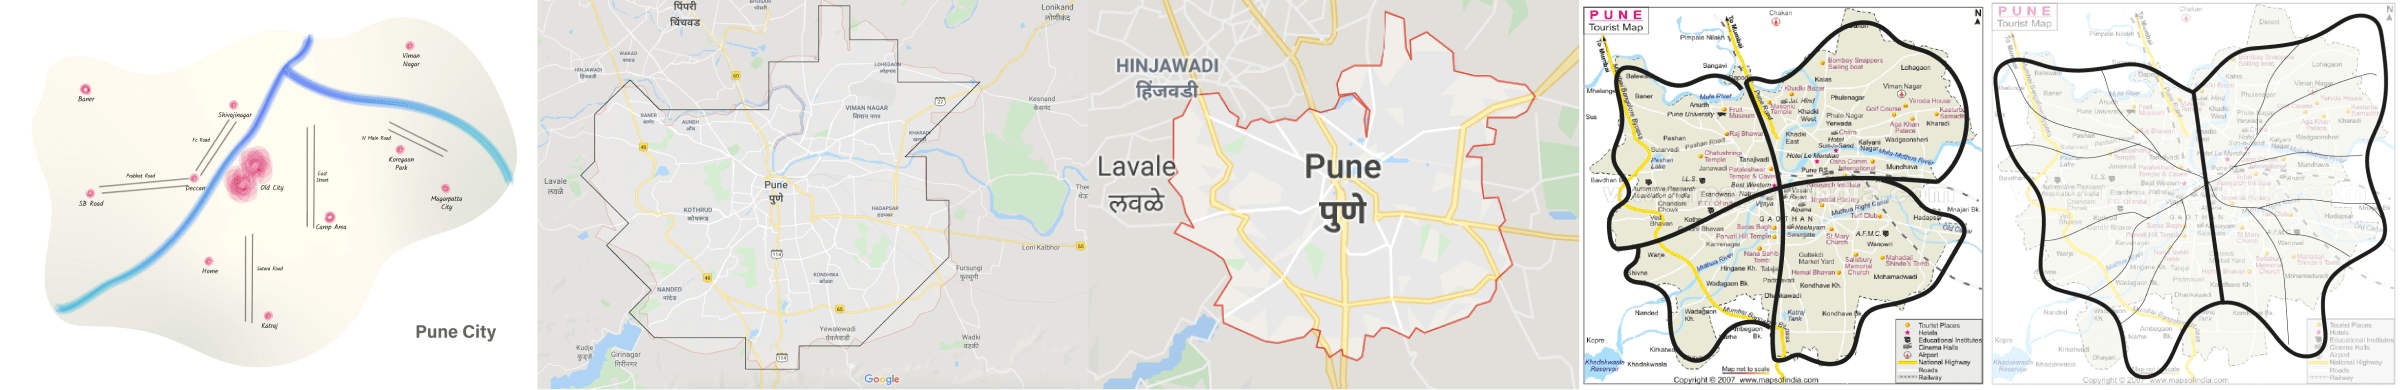
One of the exercises was to create a schematic map of their hometown, focused on a particular audience & purpose for this map. Some of the selected maps are shared below with their process, and the complete discussion & references are available on this Github issue.
Process followed:
- Define Scale, Audience & Purpose
- Sketch your mental model
- Trace relevant aspects
- Abstraction: Grids, metaphors & geometric shapes
- Simplification vs Minimal details
- Elements of the city
- Balance visual hierarchy
- Focus on design details
- Share for feedback & iteration!
Map of Gandhian Cities (Ahmedabad & Gandhinagar) by Akshay Rajpurohit
Map of Nagpur by Roopam Sonpethkar
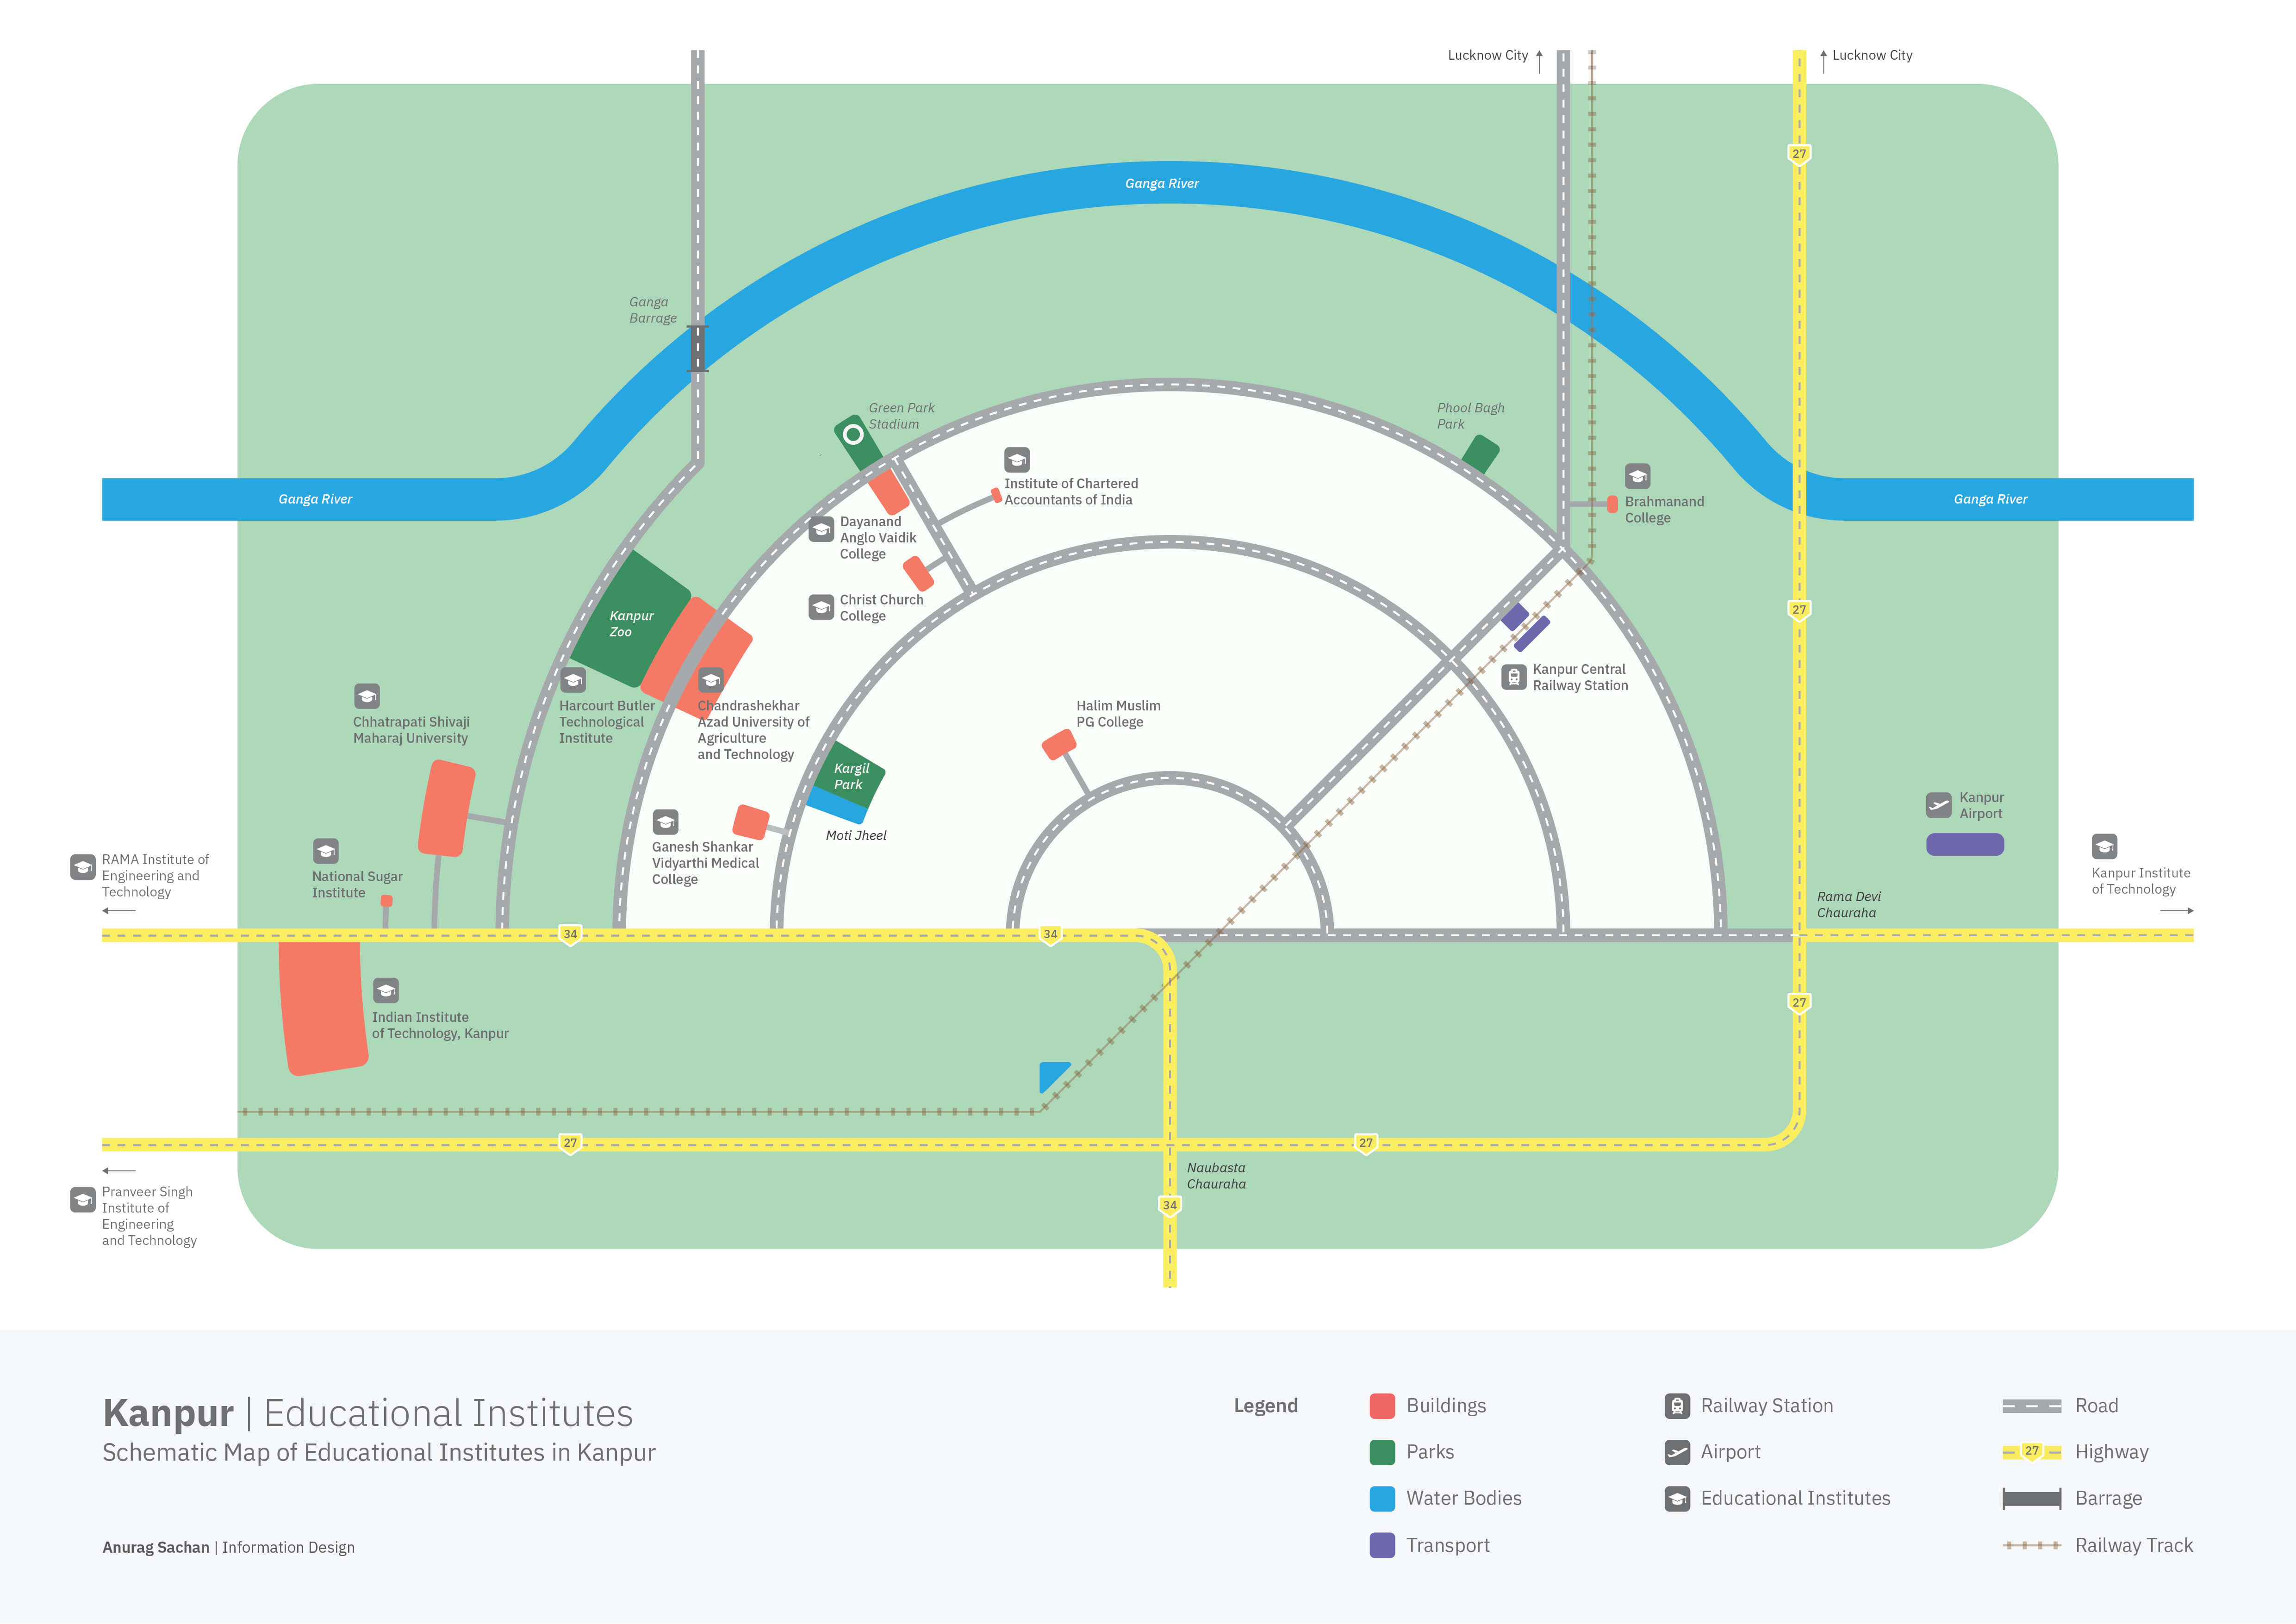
Map of Kanpur’s Educational Institutes by Anurag Sachan
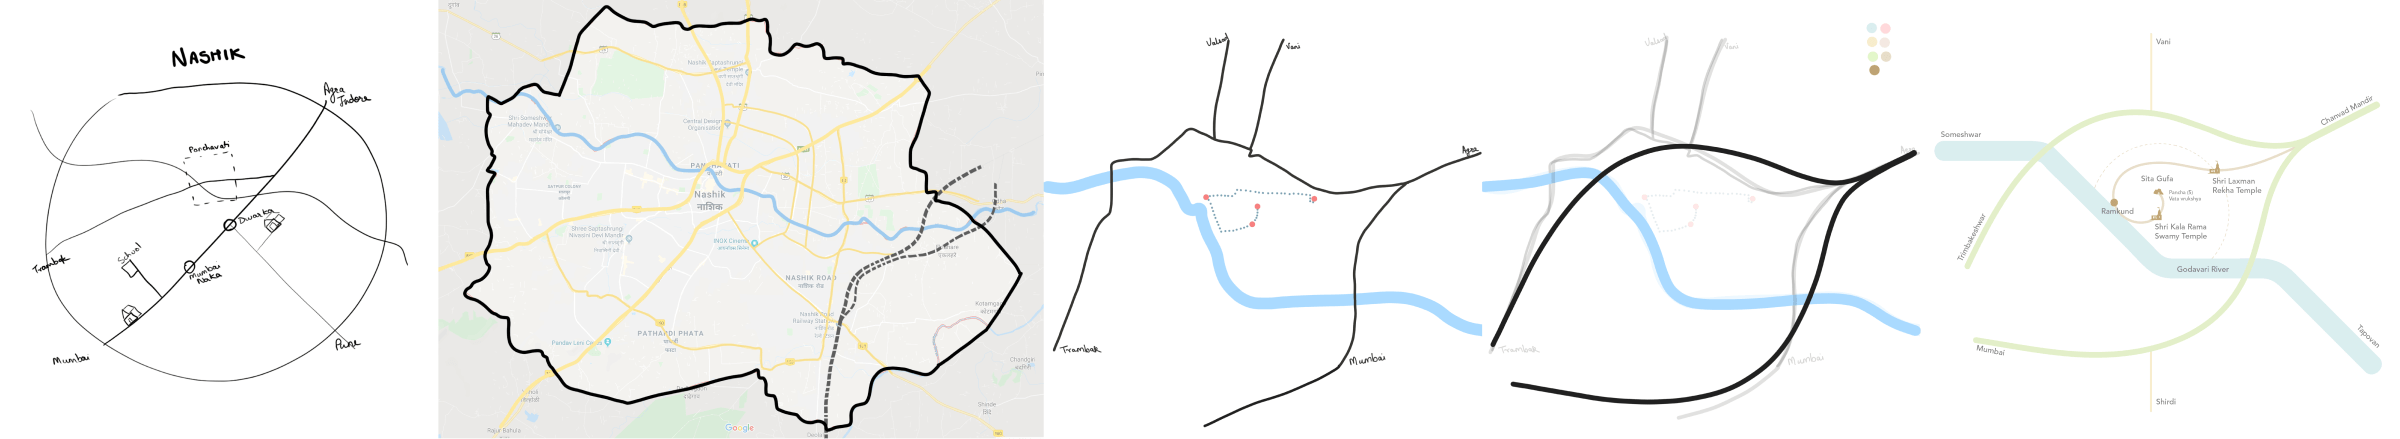
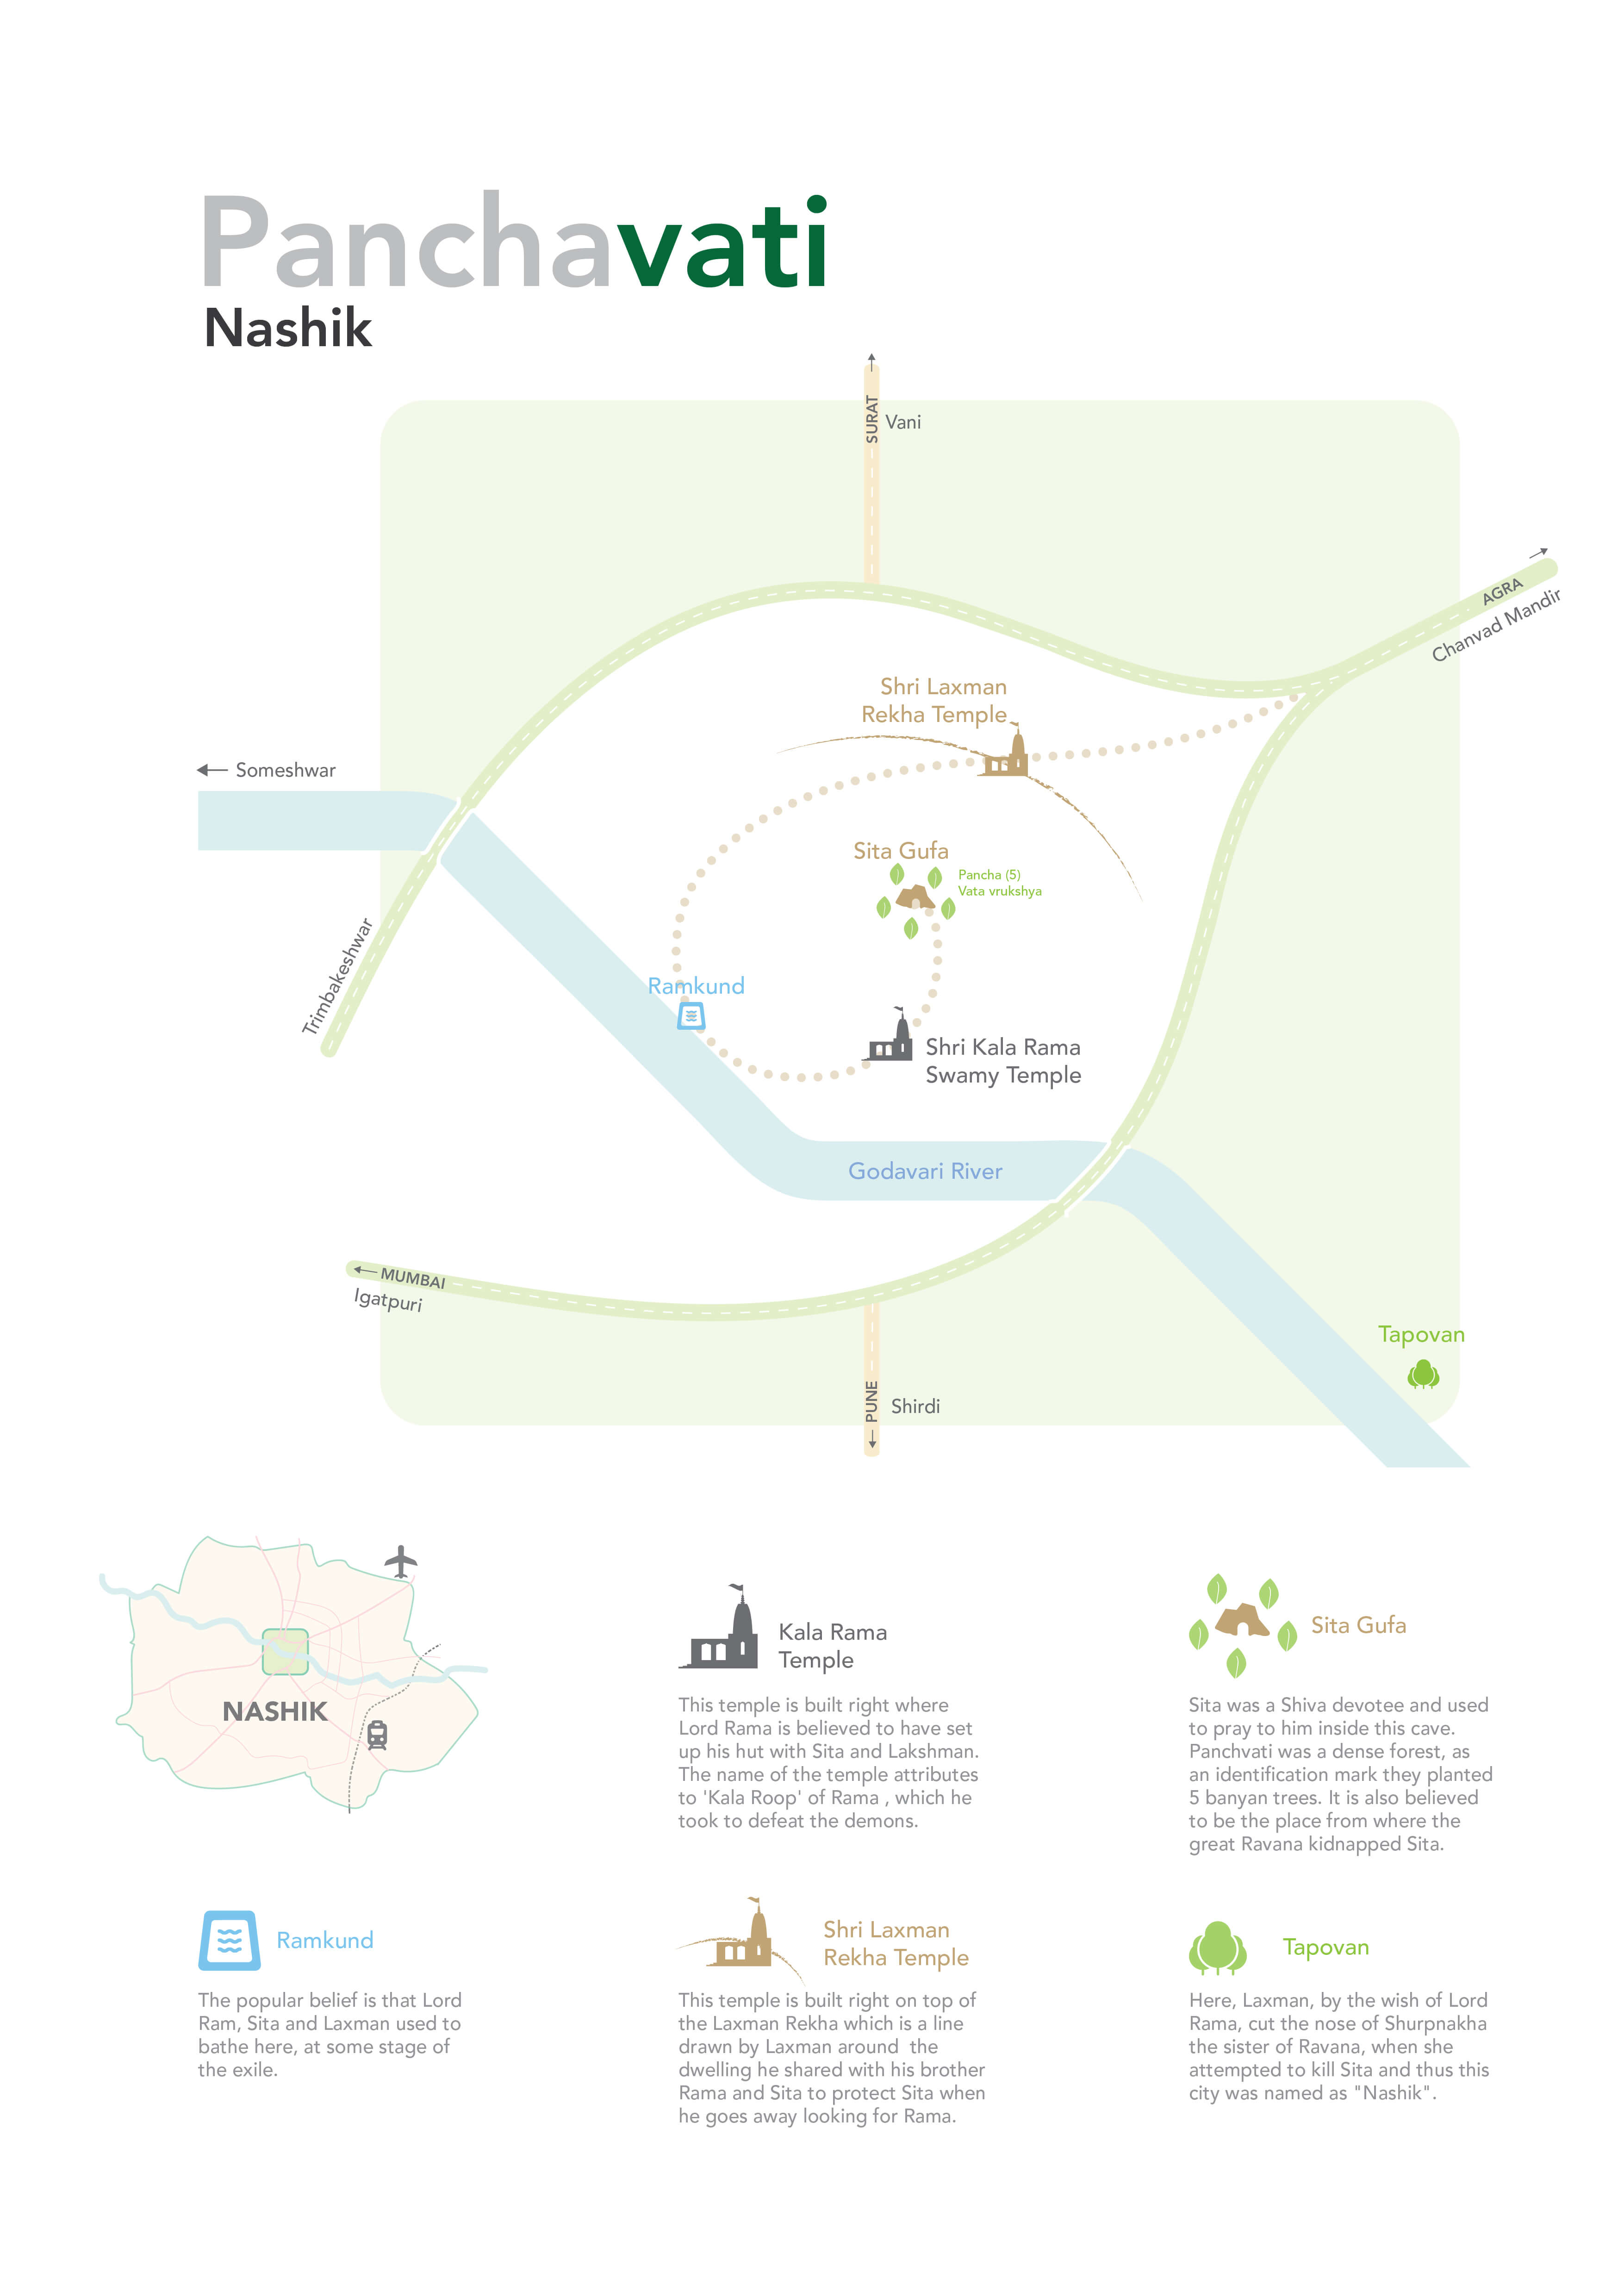
Map of Nashik by Shravani Agarkar
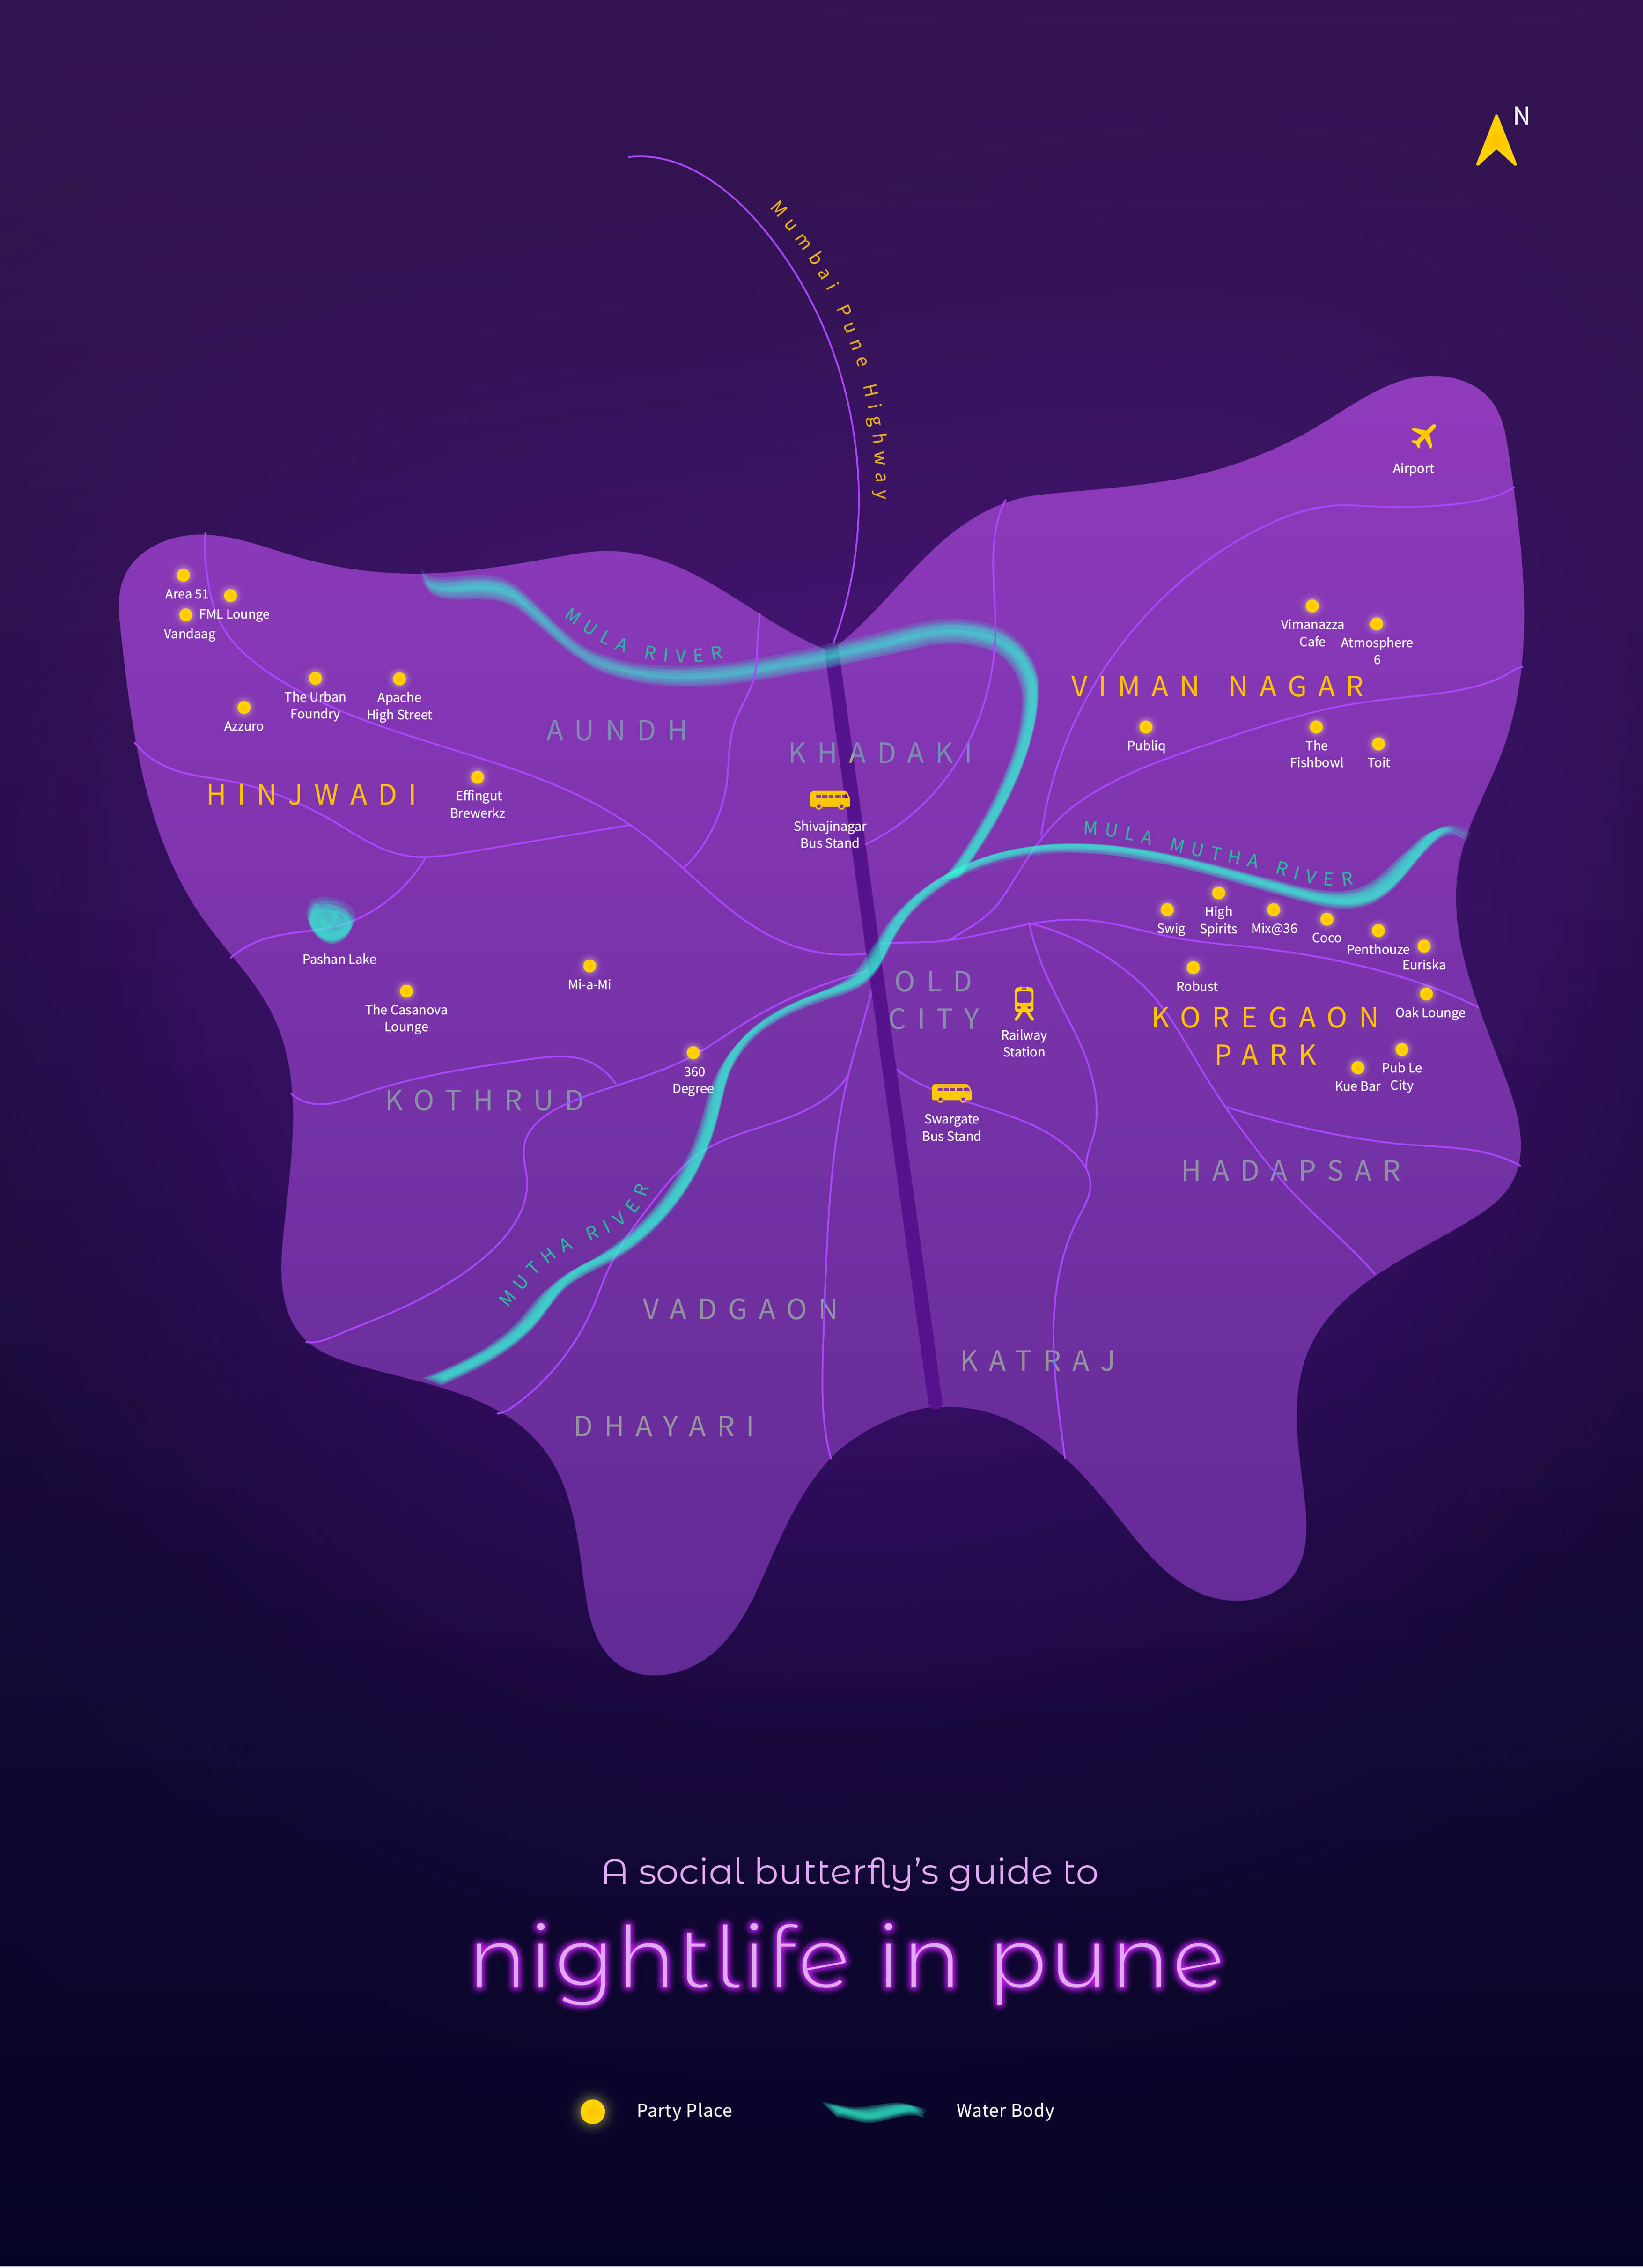
Map of Pune’s Nightlife by Tanaya
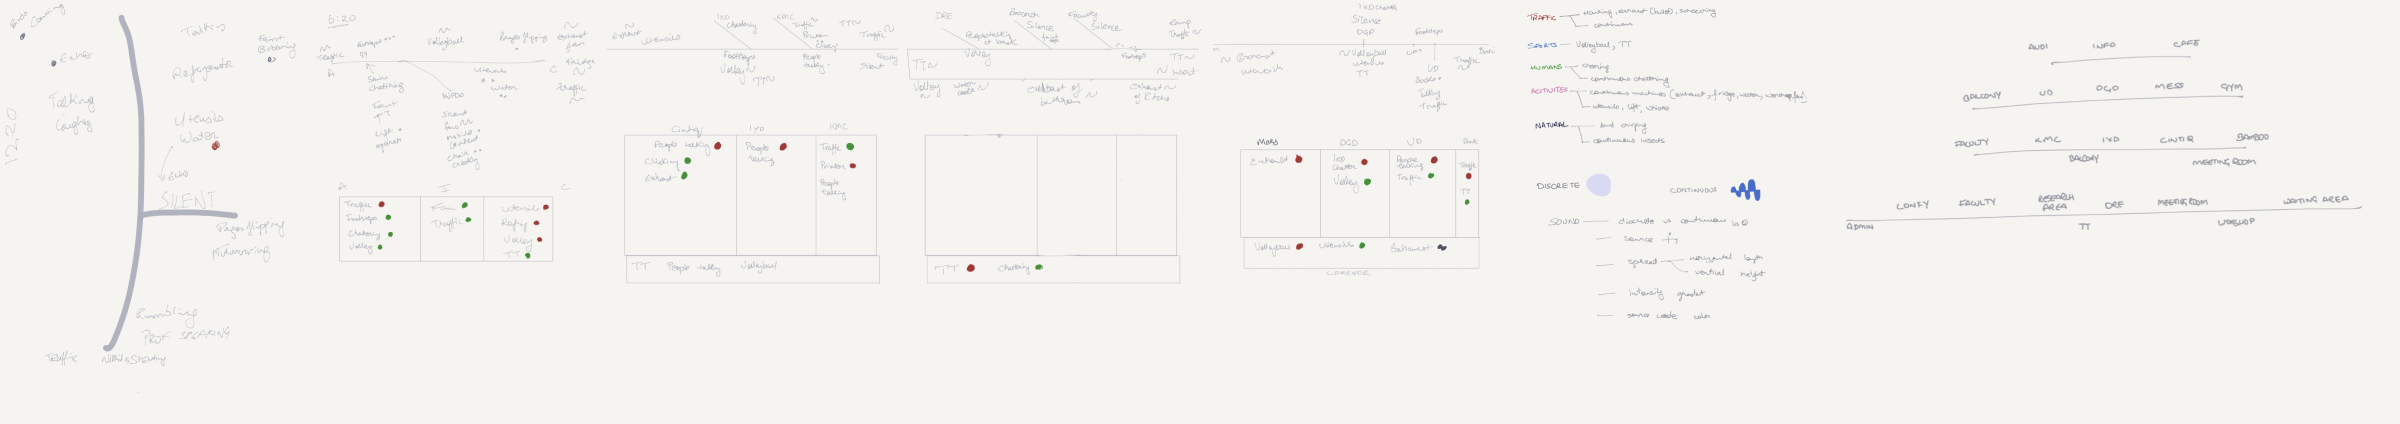
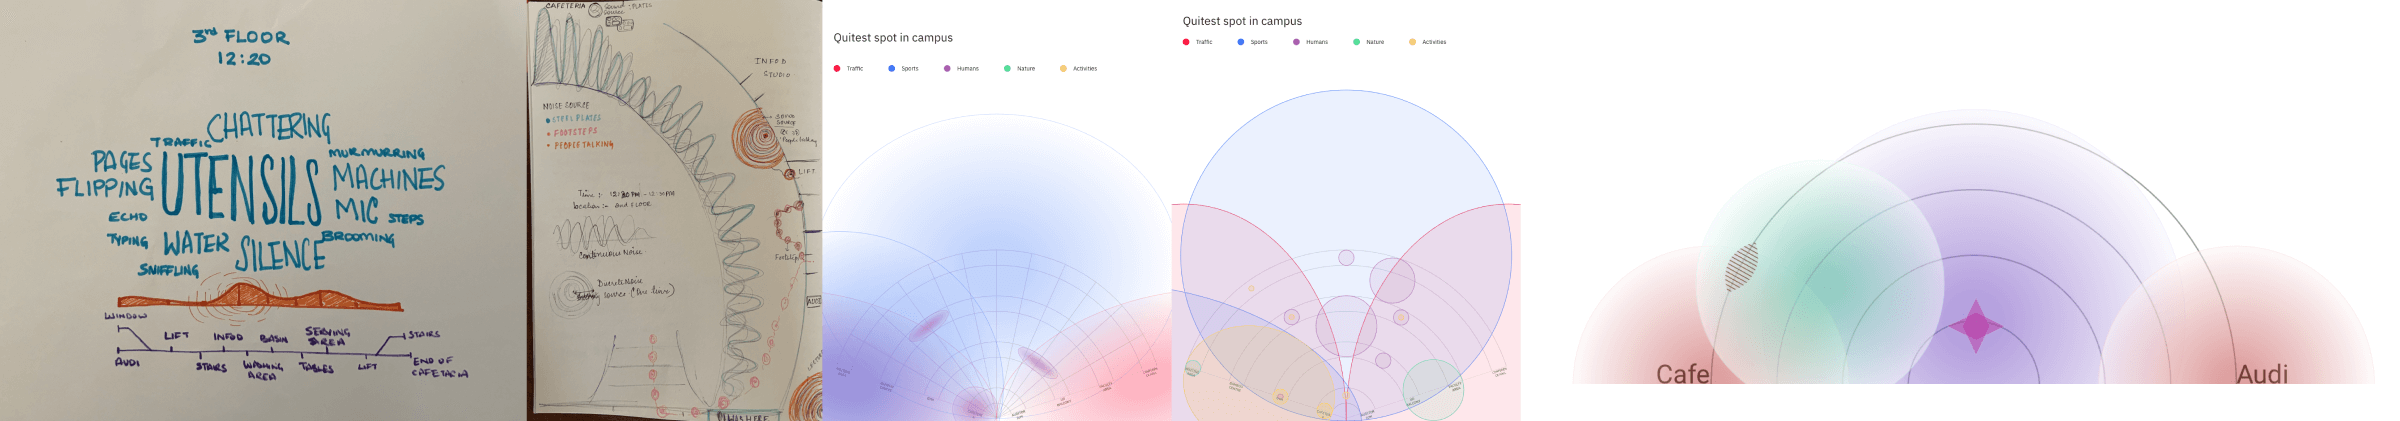
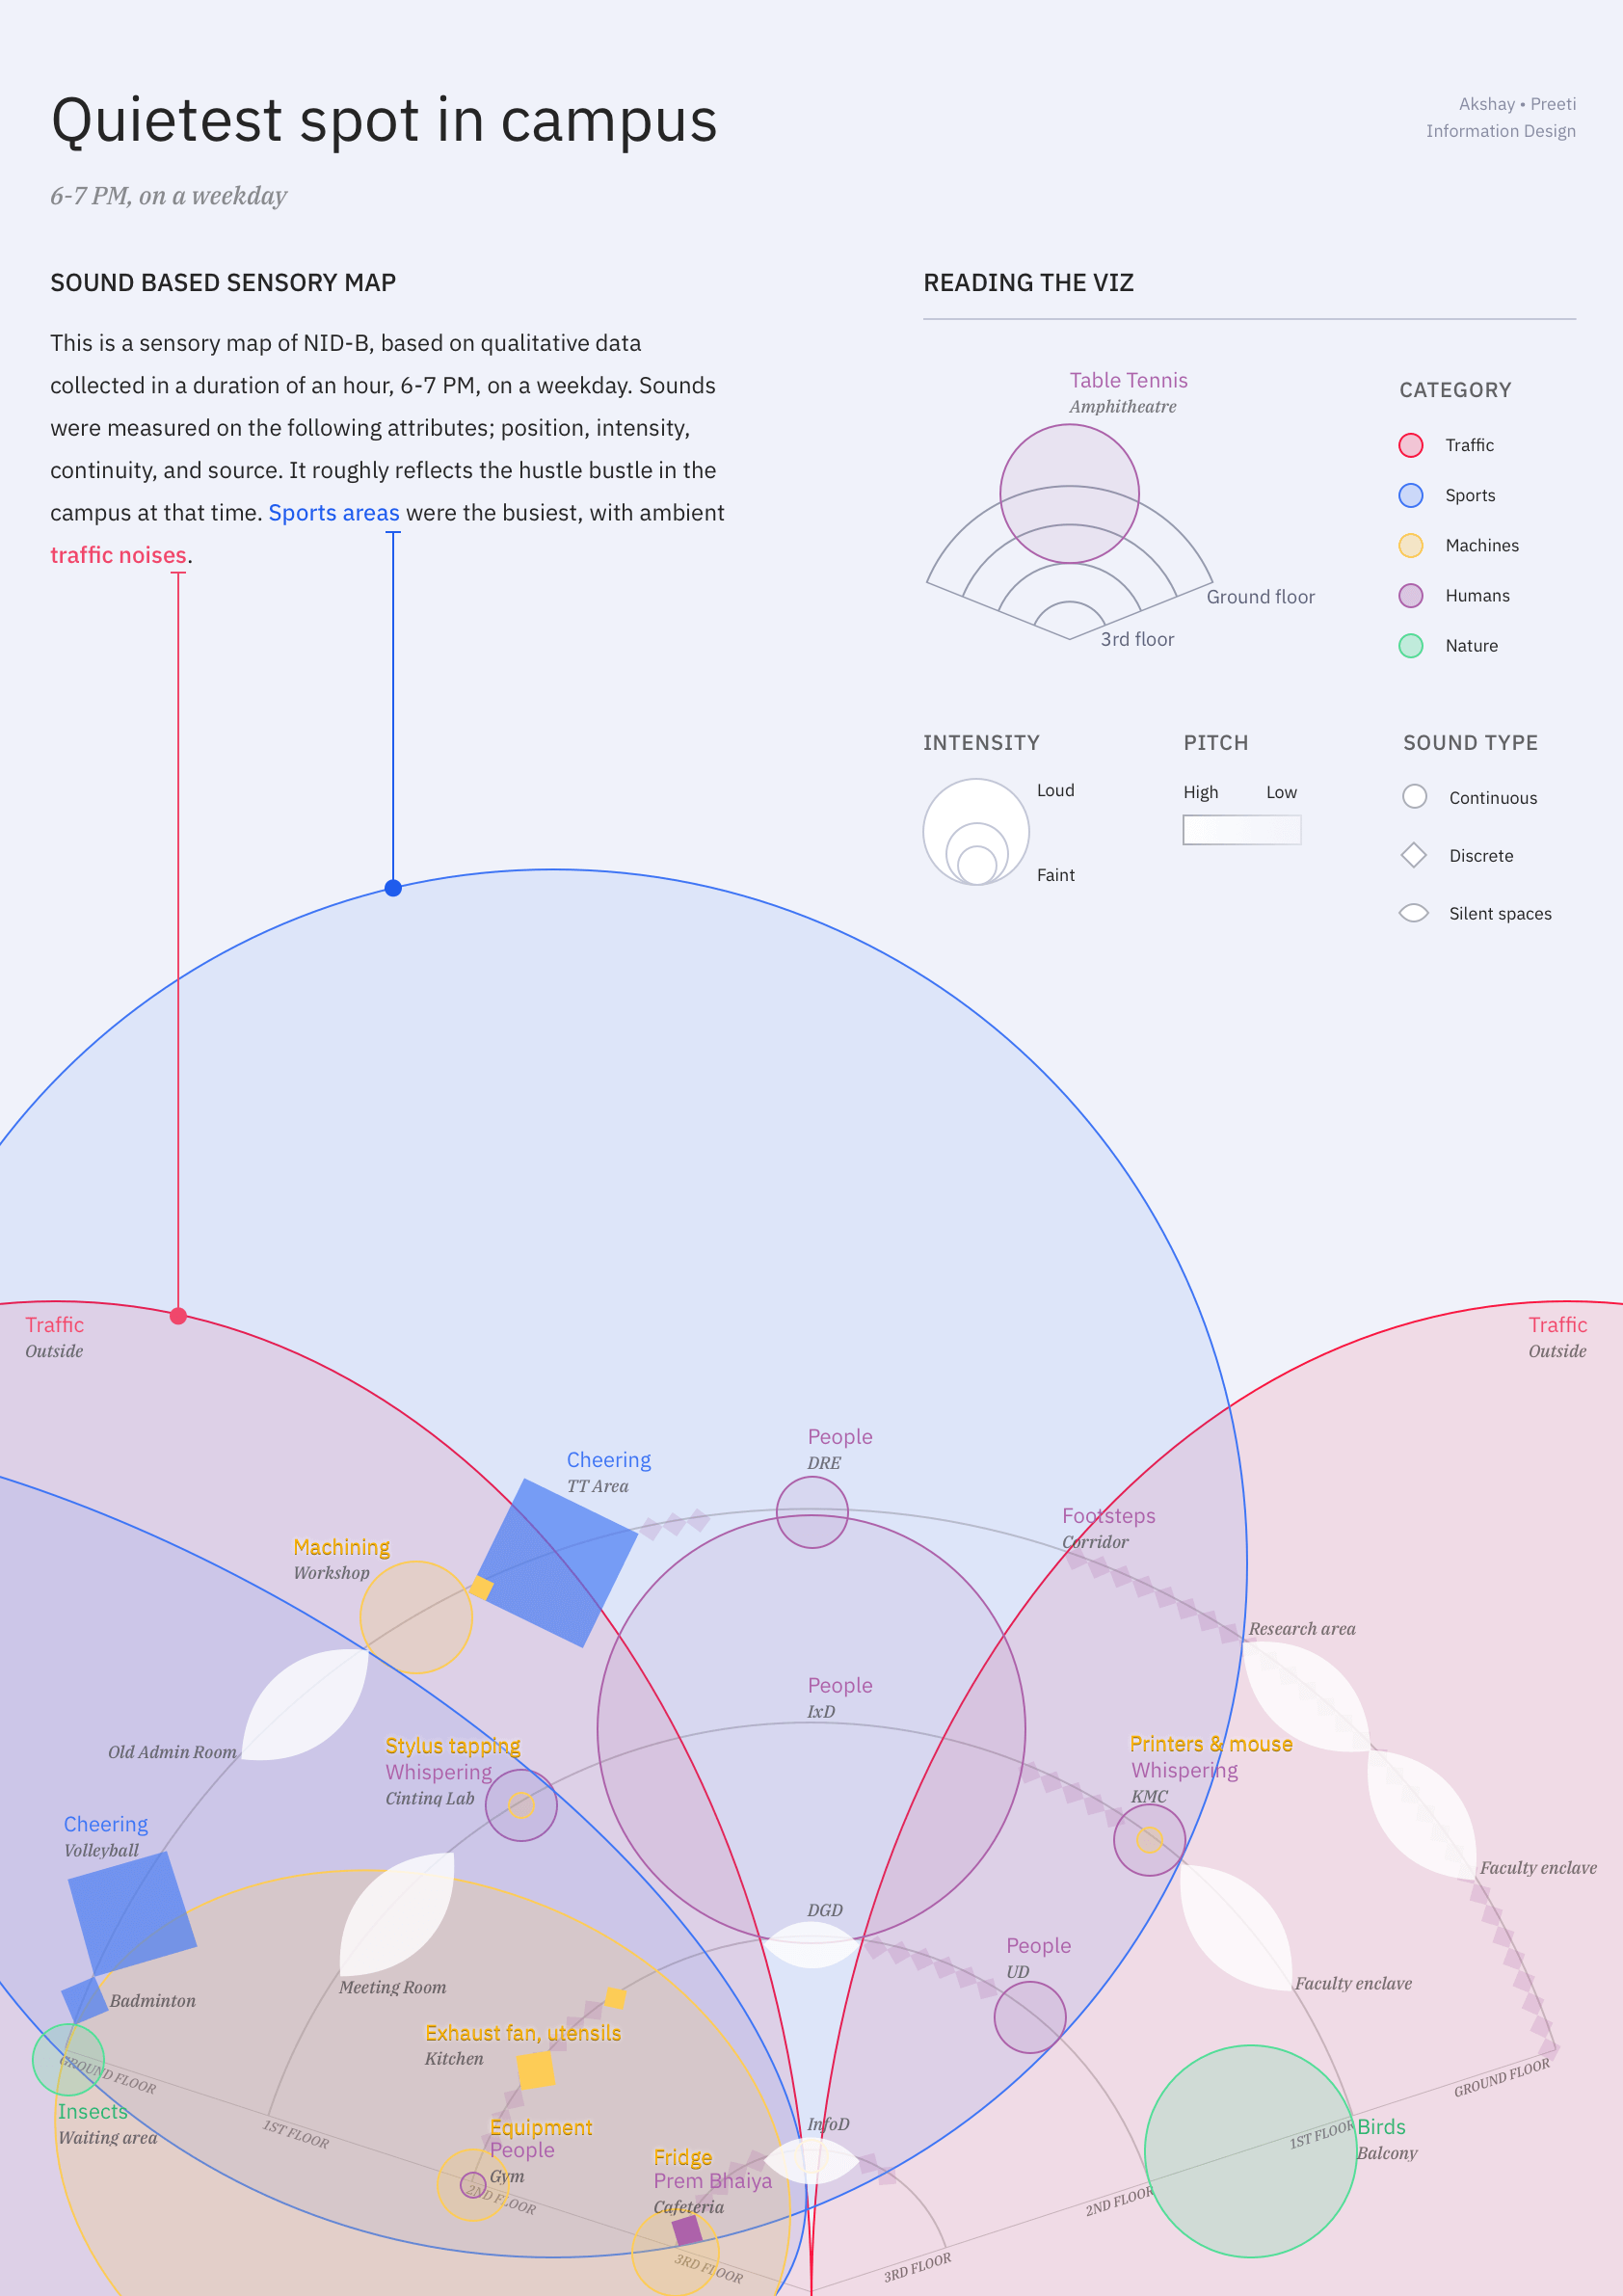
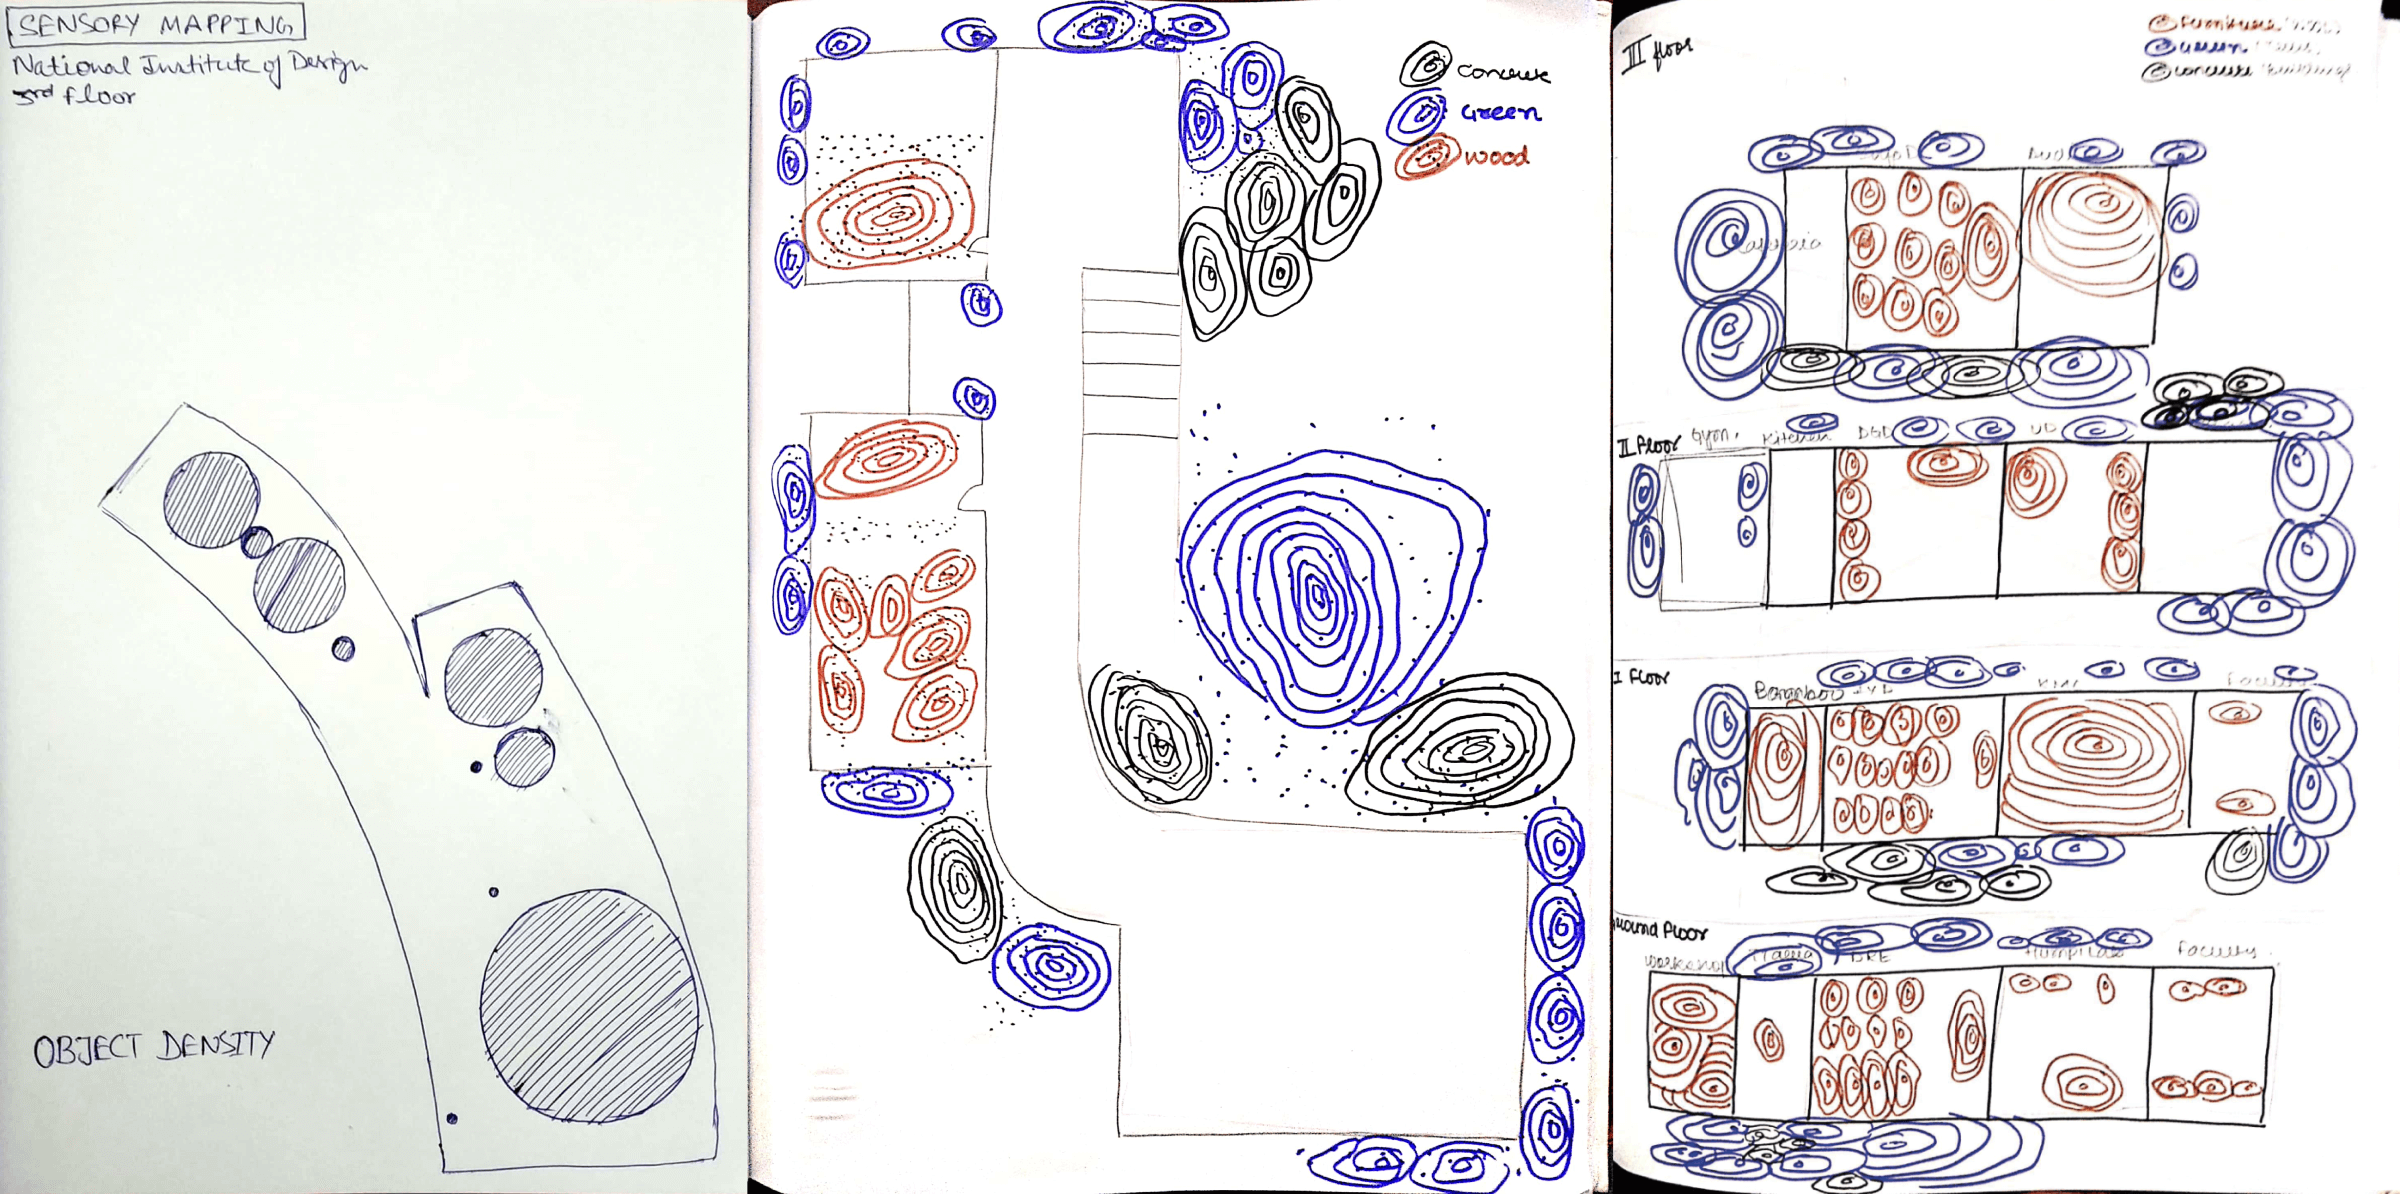
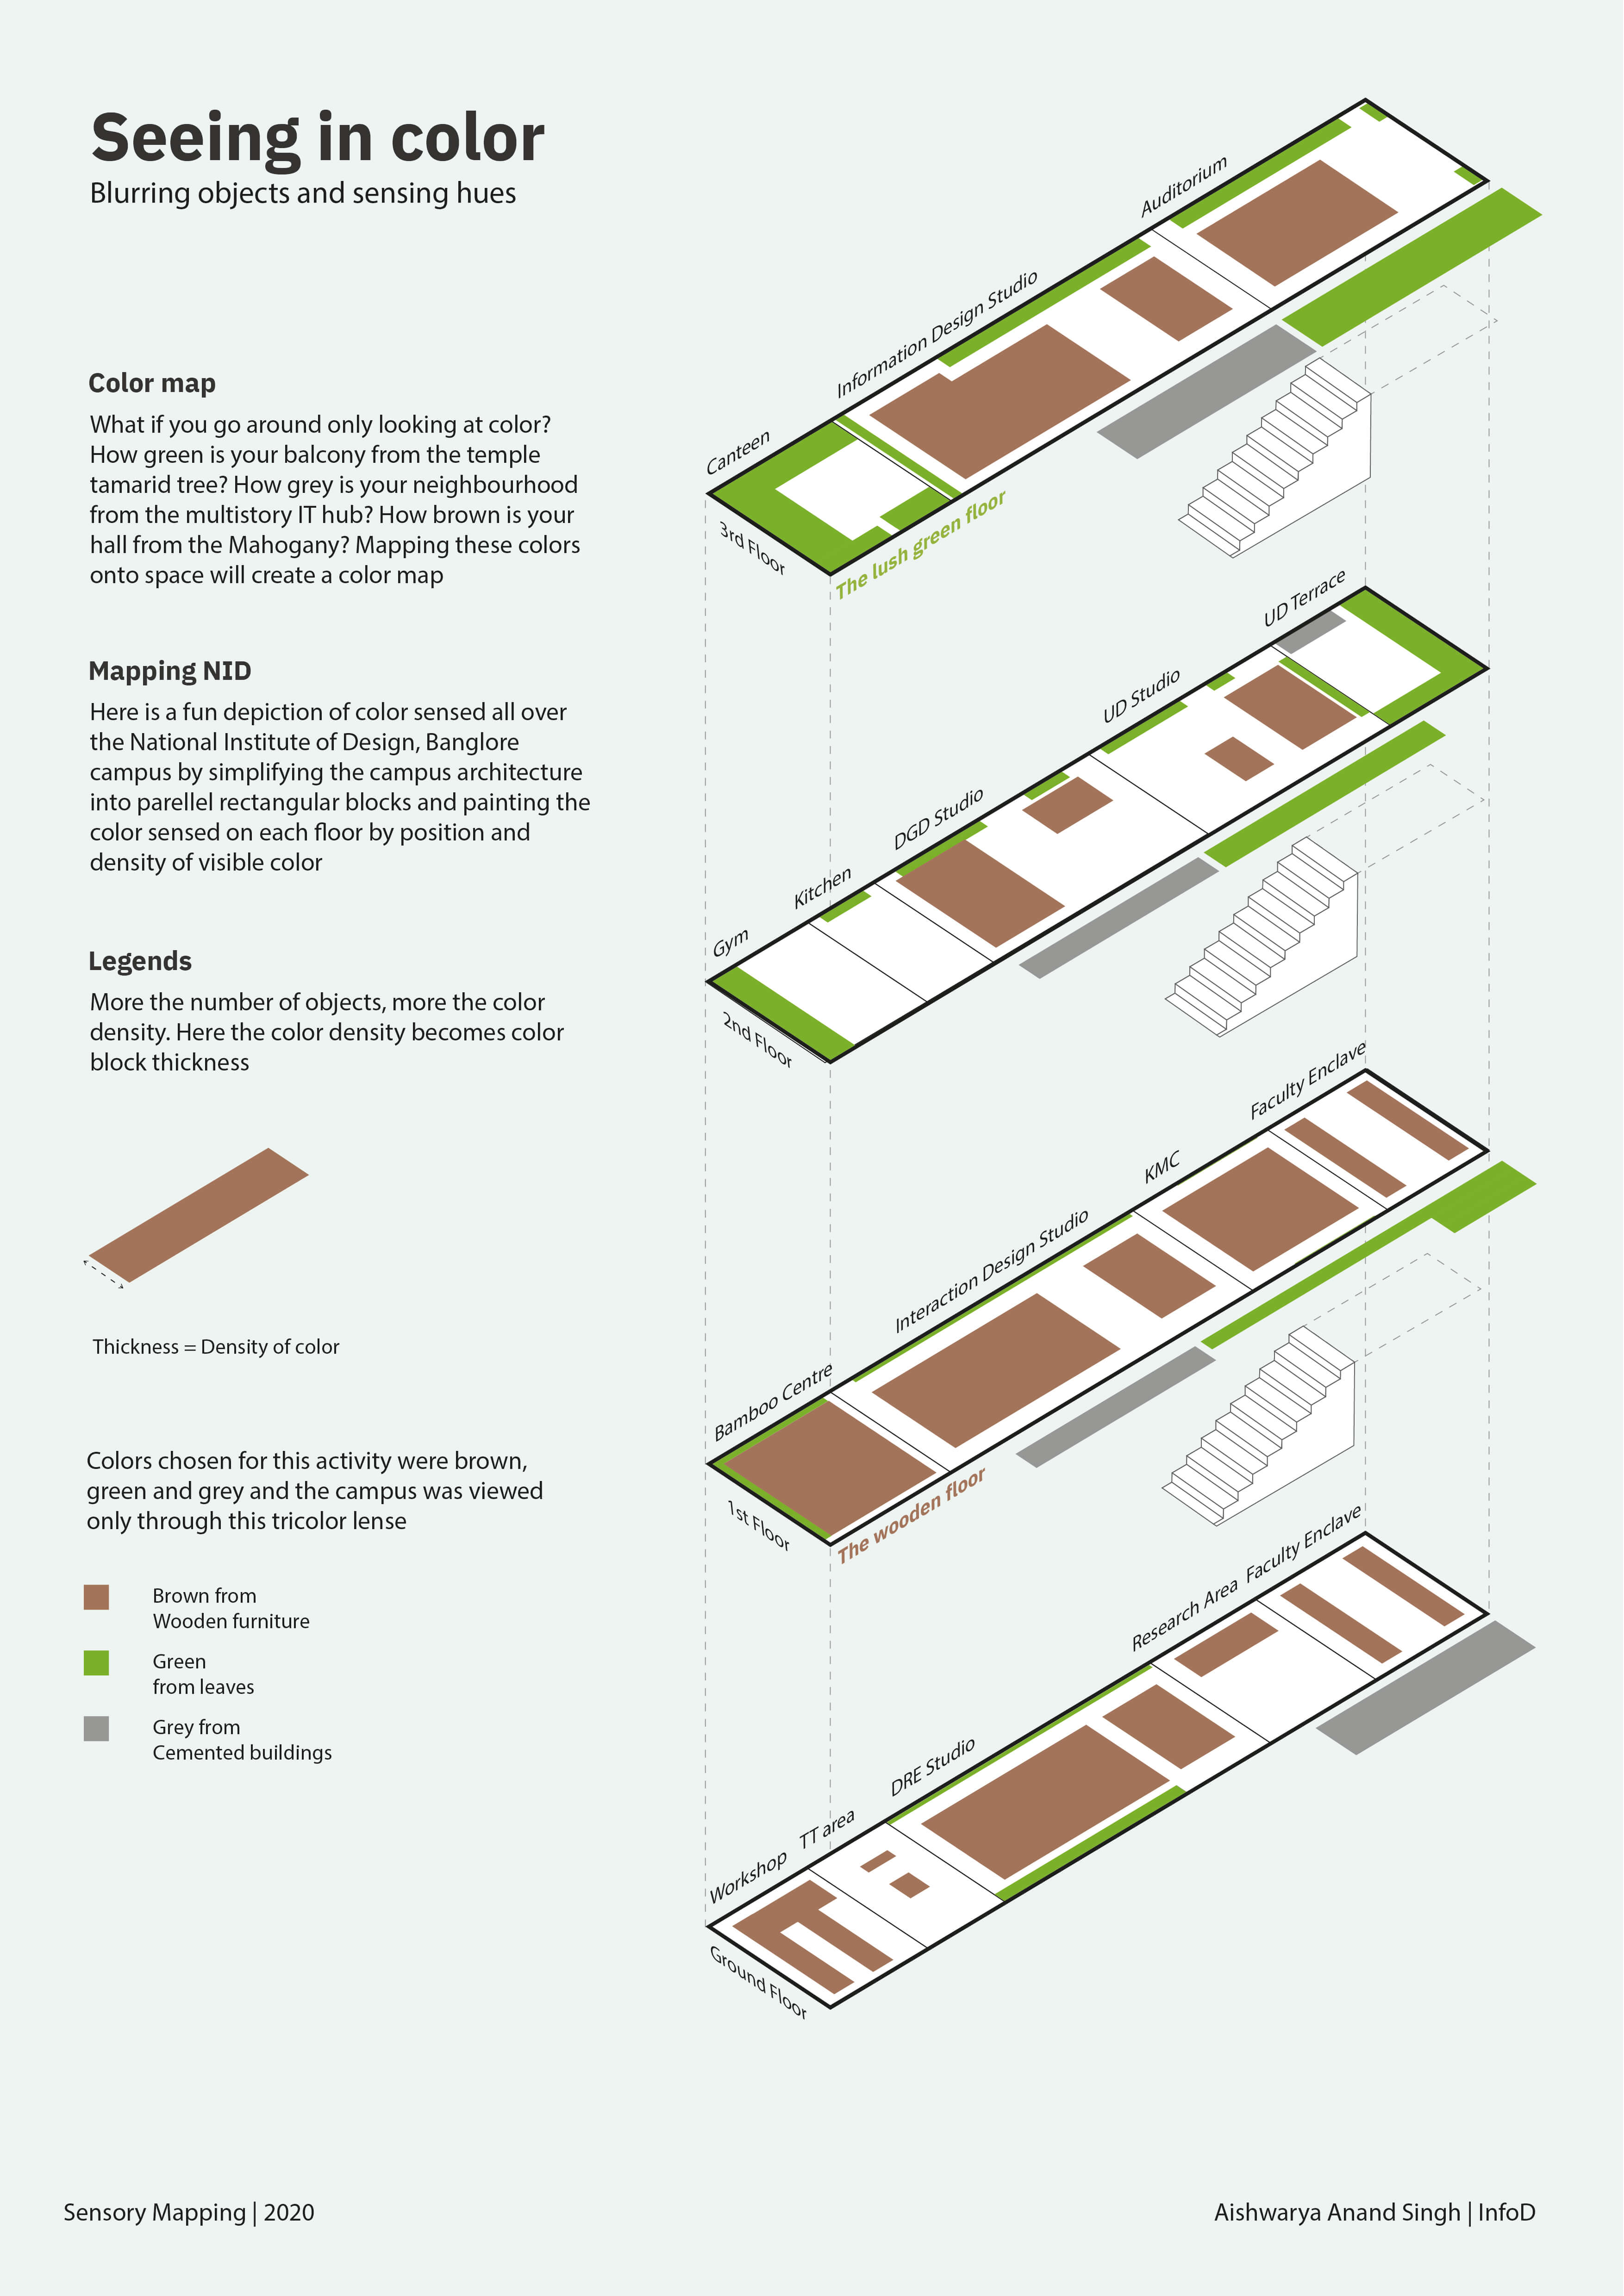
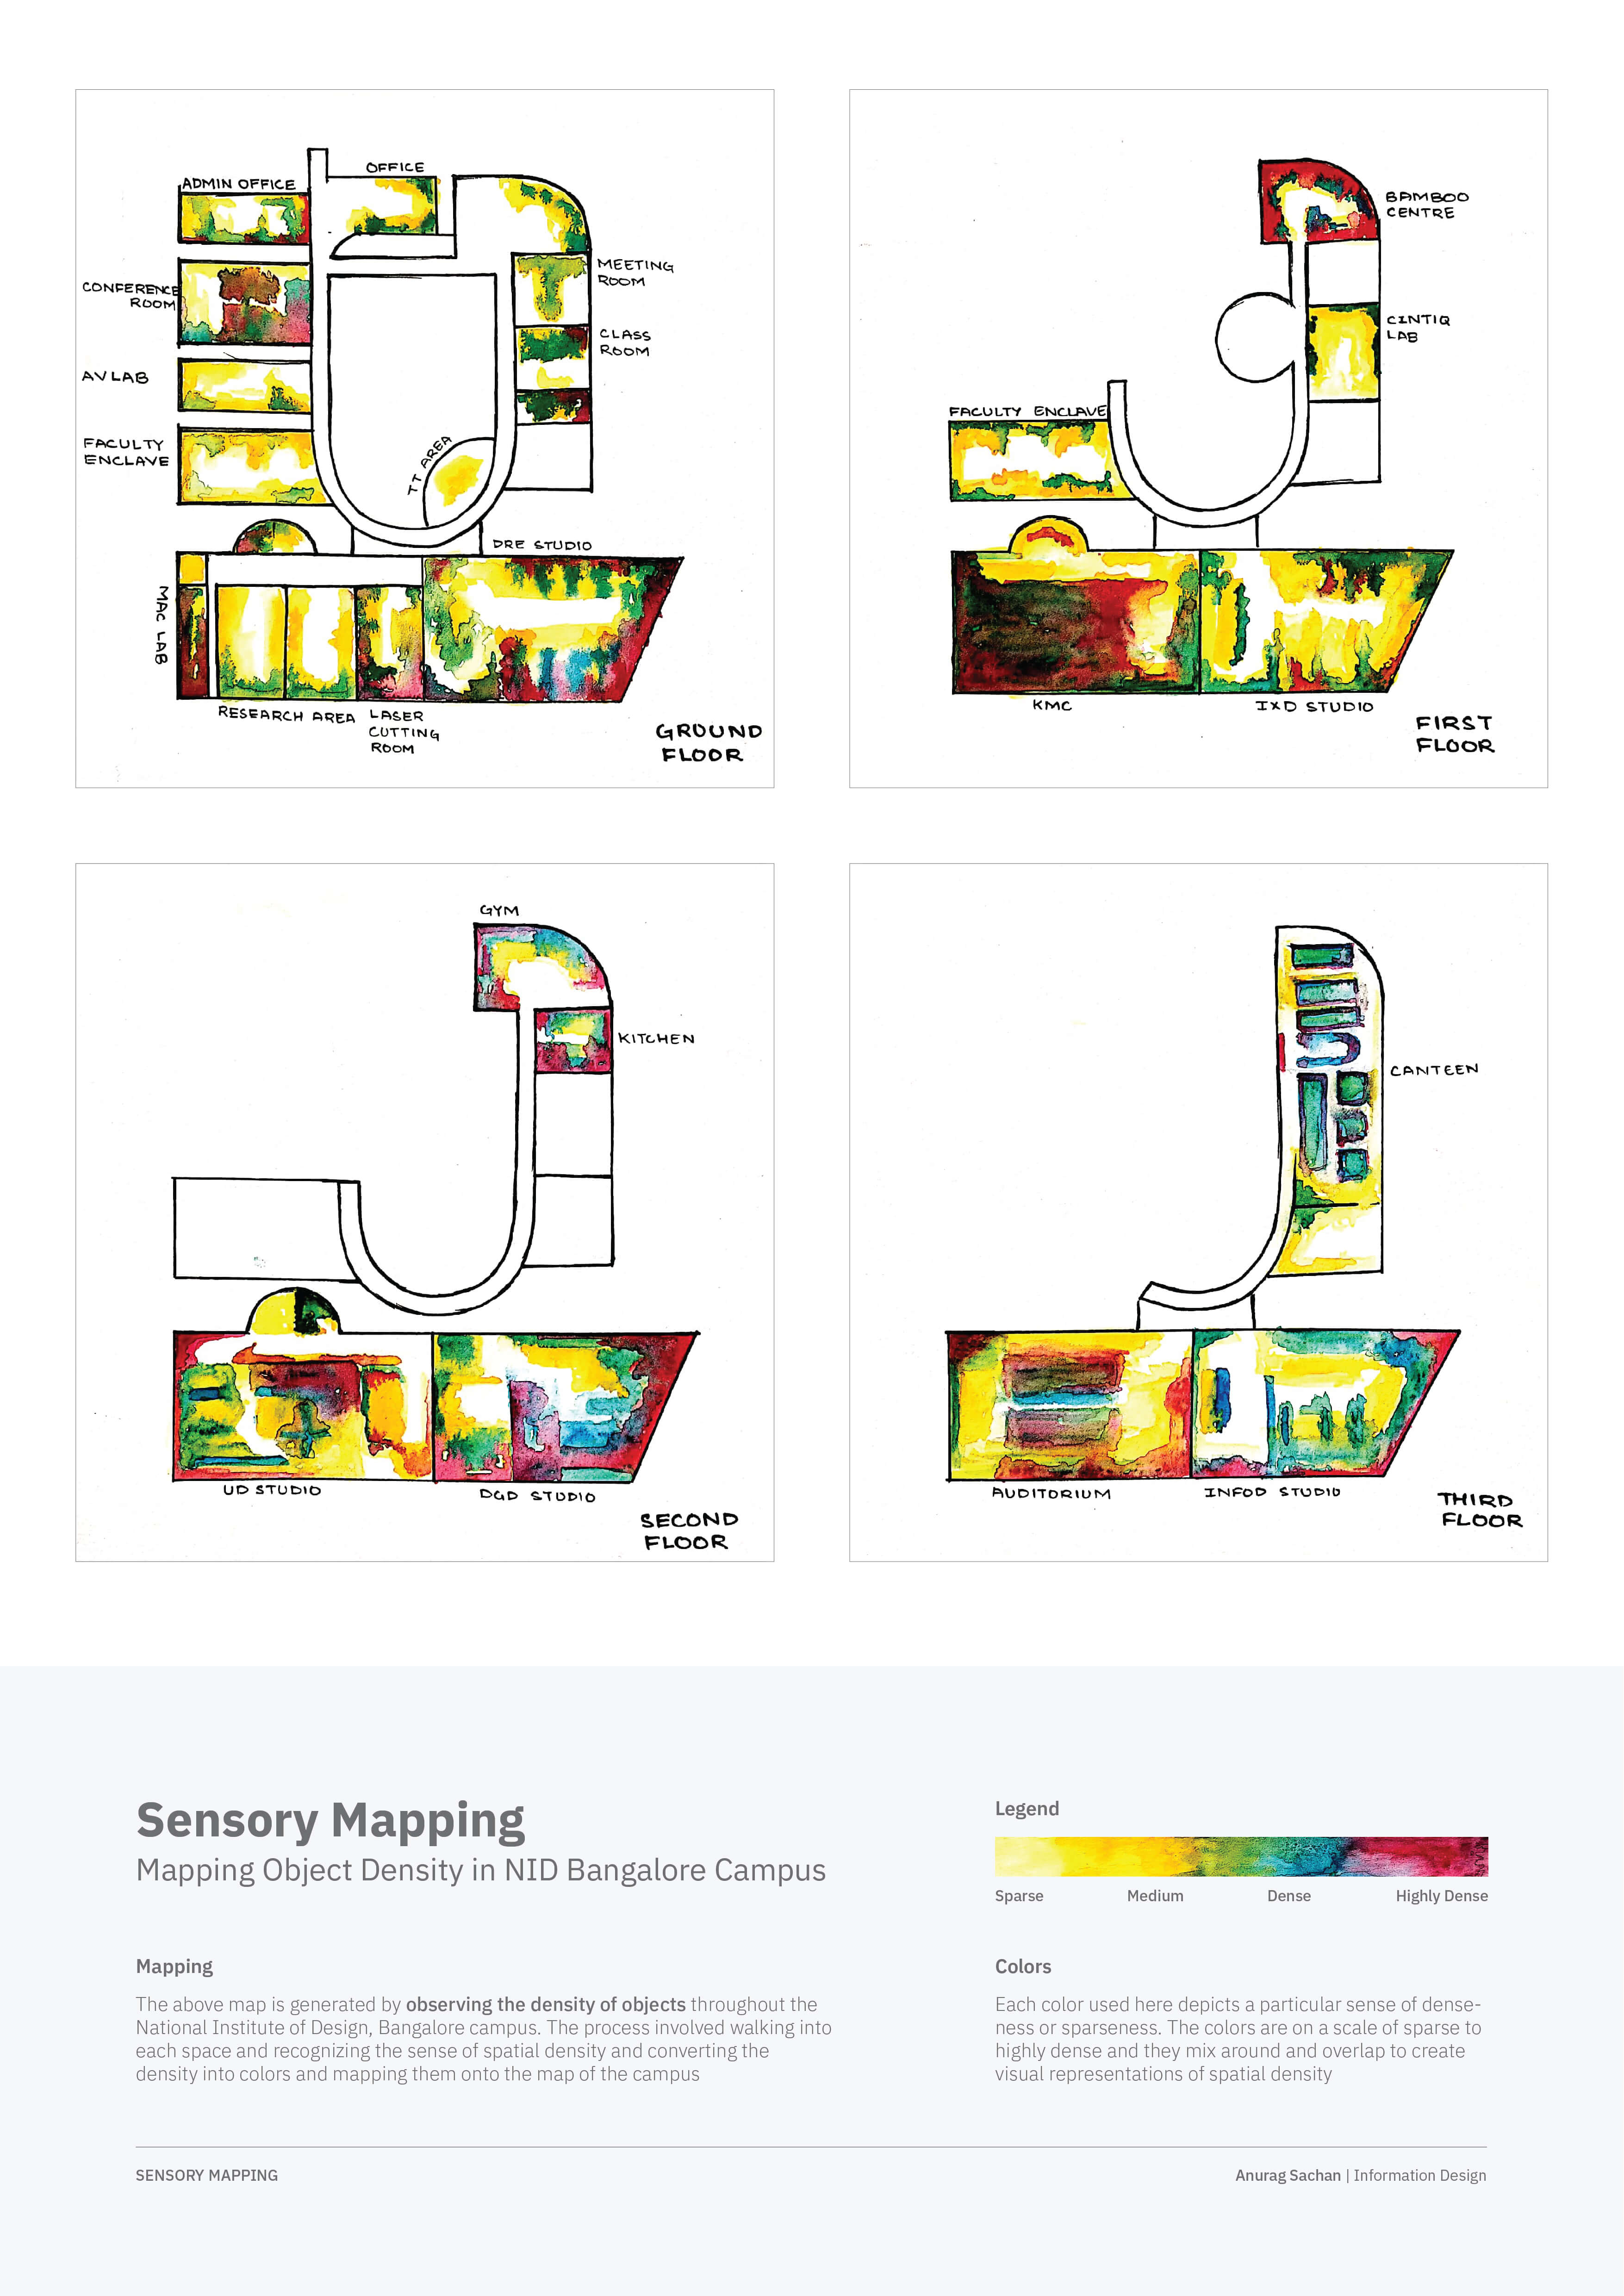
Sensory Mapping
The second exercise was focused on making a sensory map of the NID Bangalore campus. Students were split in teams and focused on one sense, and then collaborated on ways to visually represent the space through those senses. Some of the final posters by students are shared below, and process is also documented on Github.
Sound: Akshay & Preeti
Object Density & Color: Aishwarya & Anurag
Smell: Kanchan & Shravani
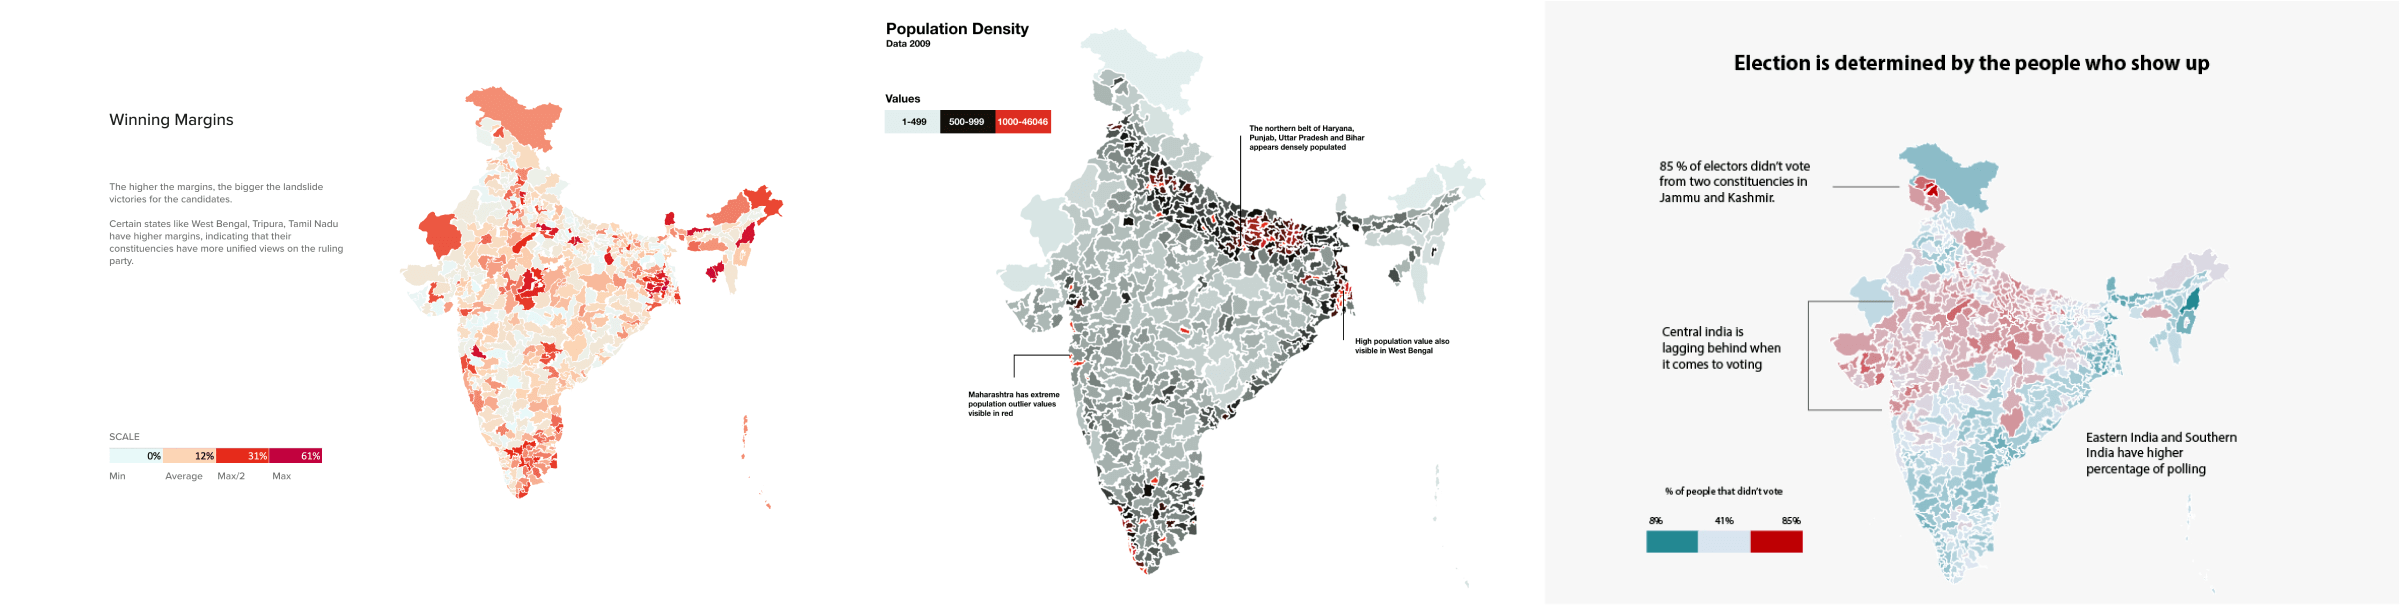
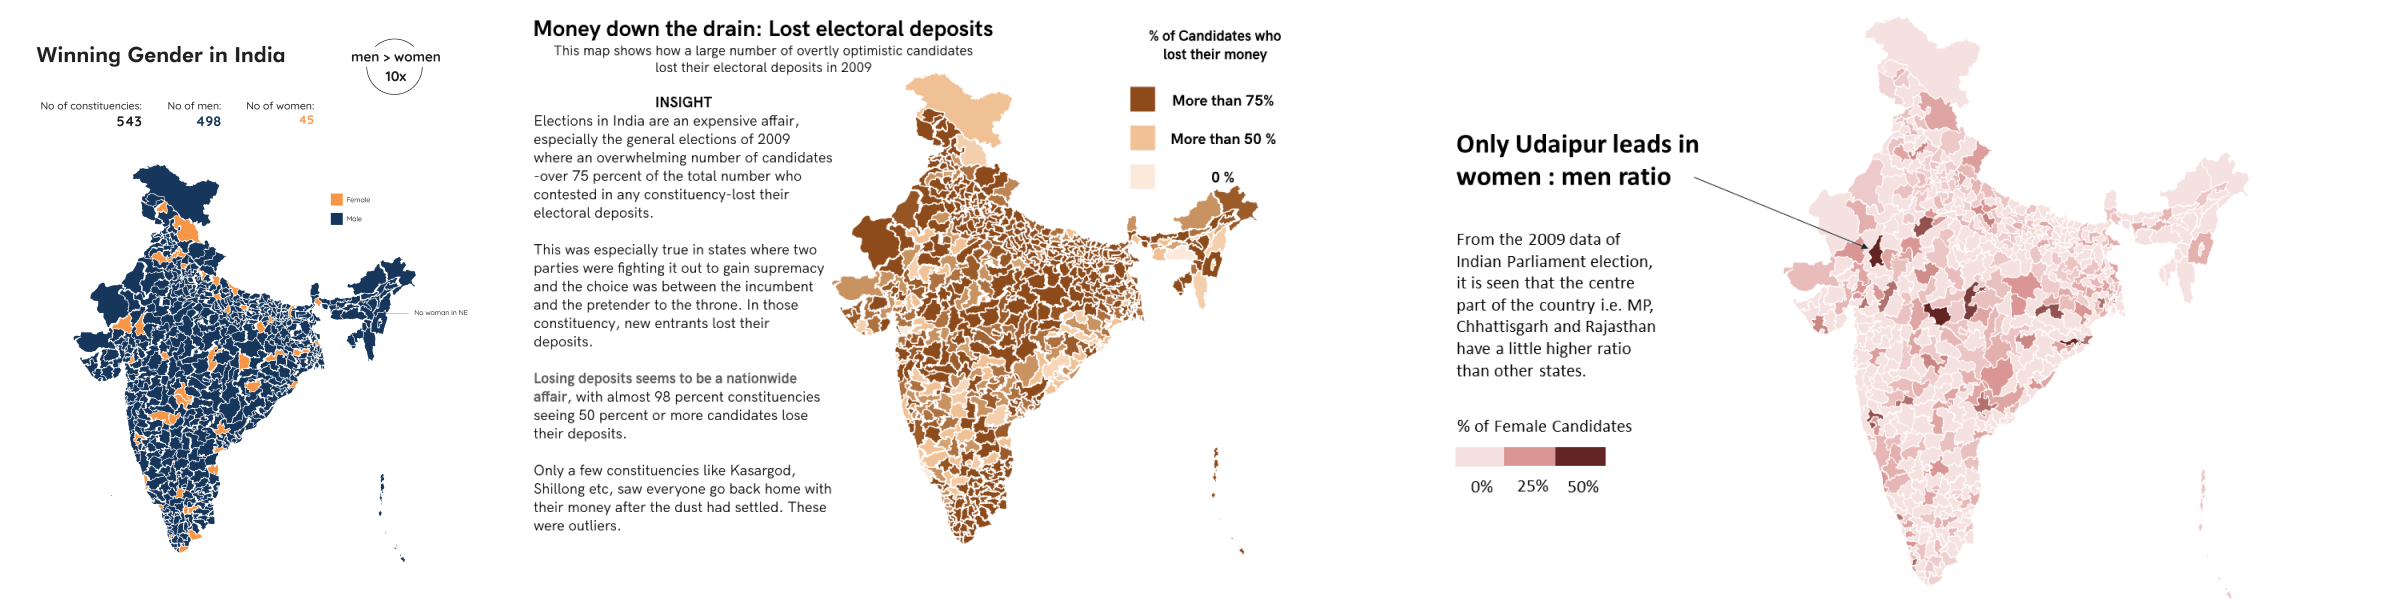
Choropleths in Excel of Indian Parliament election data
I invited S Anand to showcase his Excel choropleth templates, that allows someone to quickly enter a column of data and make a choropleth.
Process followed:
- Pick any column from the election dataset
- Update the choropleth and draw insights
- Write a story about your insights
- Enhance the map to showcase your story
Final choropleth posters
Reflections
I spent the new year break with the students, and it was worth it! It was inspiring to see all of their ideas, energy, frustration & delight while mapping the campus & iterating their schematic maps.
This time I was able to refine how to identify a good metaphor vs a poor metaphor while abstracting the schematic maps, and some of the students did wonderful work in that direction. I had tried doing a Sensory Mapping exercise a few years back that didn’t end up so well (we tried to chew too much by trying to make interactive Mapbox maps), but the approach to make static maps worked wonderfully.
We ended up doing a small exhibition of the projects at the end which was wonderful. Always fun to see such projects in a printed form!
PS: This exercise & the materials used are under CC By-NC-ND. Students own a copyright on their work, please seek their permission if you want to use their work for anything more than reference/inspiration. Read more about the license.